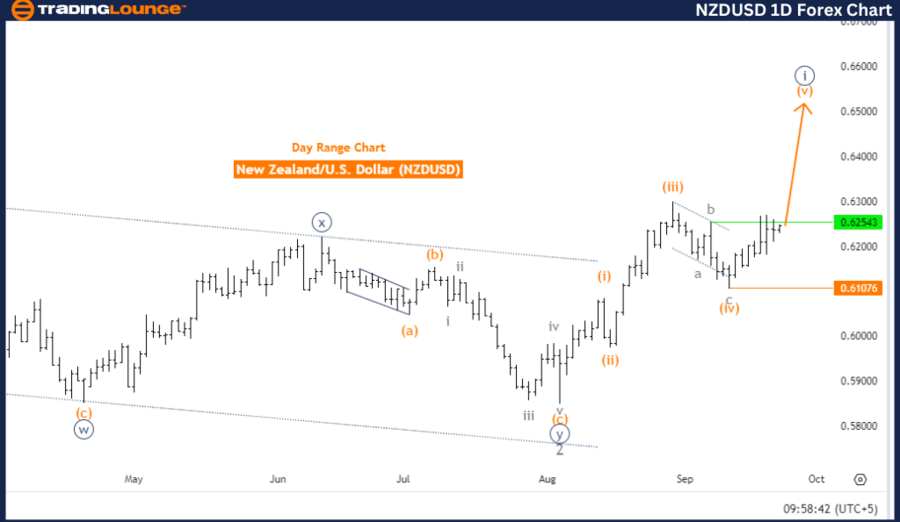
New Zealand Dollar/ U.S. Dollar (NZDUSD) TradingLounge Daily Chart
New Zealand Dollar/ U.S. Dollar Day Chart Analysis
NZDUSD Elliott Wave Technical Analysis
Function: Trend
Mode: Impulsive
Structure: Orange wave 5
Position: Navy Blue Wave 1
Next Lower Degree Direction: Navy blue wave 2
Details: Orange wave 4 is completed, and now orange wave 5 of navy blue wave 1 is in play.
Wave Cancel Invalidation Level: 0.61076
The Elliott Wave analysis for the NZDUSD daily chart shows that the pair is in a trending phase, moving impulsively. This suggests that the price action is strong and directional. The current structure is orange wave 5, typically representing the last wave in an impulsive sequence, which may signal the potential end of this cycle.
Currently, the pair is positioned in navy blue wave 1, indicating the beginning of a new wave cycle. The analysis points to navy blue wave 2 as the next lower degree, signaling a potential correction phase after orange wave 5 completes. This transition suggests that the market may enter a corrective phase soon.
The analysis highlights that orange wave 4 has concluded, which ended the last corrective phase. Now, orange wave 5 of navy blue wave 1 is progressing, indicating that the market is in the final stage of the current trend, moving in the established direction. This trend is likely to continue until the wave cycle completes.
The invalidation level for this wave structure is 0.61076. If the price falls below this threshold, the current Elliott Wave analysis will be invalid, and a new assessment will be required.
Summary:
The NZDUSD pair is in an impulsive trend phase, with orange wave 5 of navy blue wave 1 currently advancing. A correction phase (navy blue wave 2) is expected after the completion of wave 5, provided the price stays above 0.61076.
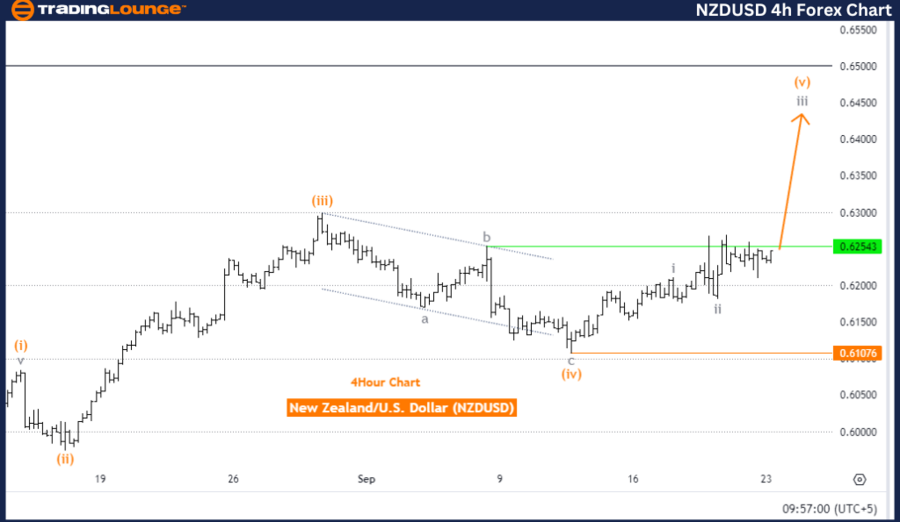
New Zealand Dollar/ U.S. Dollar (NZDUSD) TradingLounge 4-Hour Chart
New Zealand Dollar/ U.S. Dollar (NZDUSD) 4-Hour Chart Analysis
NZDUSD Elliott Wave Technical Analysis
Function: Trend
Mode: Impulsive
Structure: Gray wave 3
Position: Orange wave 5
Next Higher Degree Direction: Gray wave 3 (started)
Details: Gray wave 2 is completed, and gray wave 3 is now in progress.
Wave Cancel Invalidation Level: 0.61076
The Elliott Wave analysis for the NZDUSD 4-hour chart reveals that the market is trending, moving in an impulsive phase. This indicates strong momentum in the price movement, driven by the dominant trend. The current structure is gray wave 3, which typically represents a strong continuation of the trend, either upward or downward.
At present, the pair is positioned in orange wave 5, which is part of the larger gray wave 3 structure. This means that the market is nearing the end of an impulsive wave sequence, as wave 5 usually signifies the final wave. The analysis suggests that gray wave 3 has already started, and the market is advancing within this wave, with momentum building in the direction of the overall trend.
The details confirm that gray wave 2 has finished, marking the conclusion of the last corrective phase. Now, the market is progressing in gray wave 3, which represents a strong impulsive move, likely continuing the trend's direction.
The wave invalidation level is set at 0.61076. If the price drops below this level, the current wave structure will be invalidated, and a new wave count will need to be determined.
Summary:
The NZDUSD pair is in a trending phase with gray wave 3 in progress, following the completion of gray wave 2. The market is expected to continue moving impulsively as part of orange wave 5, maintaining its upward or downward trend, provided the price remains above 0.61076.
Technical Analyst: Malik Awais
Source: visit Tradinglounge.com and learn From the Experts Join TradingLounge Here
Previous: British Pound/ U.S. Dollar (GBPUSD) Elliott Wave Technical Analysis
VALUE Offer - Buy 1 Month & Get 3 Months!Click here
Access 7 Analysts Over 200 Markets Covered. Chat Room With Support