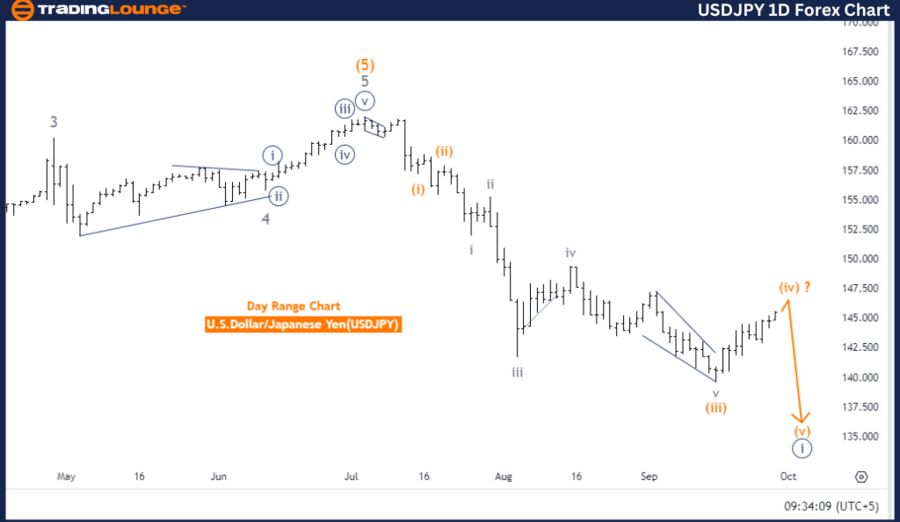
USDJPY Elliott Wave Analysis - Trading Lounge Day Chart
U.S. Dollar / Japanese Yen (USDJPY) Day Chart Analysis
USDJPY Elliott Wave Technical Analysis
Function: Counter Trend
Mode: Corrective
Structure: Orange Wave 4
Position: Navy Blue Wave 1
Direction Next Lower Degrees: Orange Wave 5
Details: Orange Wave 3 appears complete, with Orange Wave 4 currently in progress.
The USDJPY Day Chart reveals that the market is in a corrective phase according to Elliott Wave analysis, indicating a counter-trend movement. The observed wave structure is Orange Wave 4, a temporary correction that typically occurs after an impulsive wave.
Currently, the market is positioned in Navy Blue Wave 1, suggesting the initiation of a new wave cycle. As Orange Wave 4 progresses, the next significant move is expected to be to the downside, leading to Orange Wave 5.
The analysis points out that Orange Wave 3 has concluded, signaling the end of an upward impulsive move. With Orange Wave 4 now active, the market is experiencing a typical wave 4 corrective phase. Once Orange Wave 4 is completed, the market is expected to shift into Orange Wave 5, resuming the broader upward trend. Orange Wave 5 will serve as the final impulsive wave in this sequence, concluding the overall wave structure.
Key Takeaways:
- The USDJPY Day Chart is currently in a corrective phase, with Orange Wave 4 following the completion of Orange Wave 3.
- The market is positioned in Navy Blue Wave 1, marking the start of a new wave cycle.
- Upon completion of Orange Wave 4, the chart expects a bullish move into Orange Wave 5, continuing the broader trend.
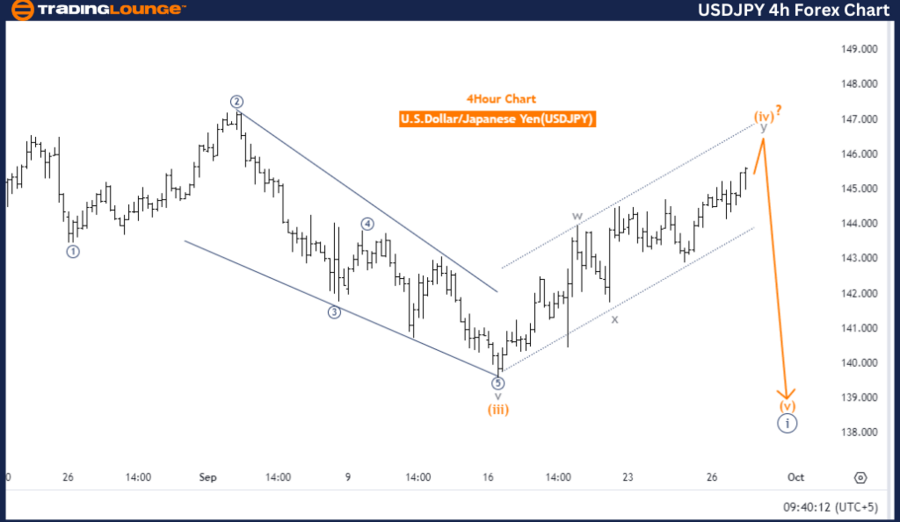
U.S. Dollar / Japanese Yen (USDJPY) 4-Hour Chart
USDJPY Elliott Wave Technical Analysis
Function: Counter Trend
Mode: Corrective
Structure: Orange Wave 4
Position: Navy Blue Wave 1
Direction Next Lower Degrees: Orange Wave 5
Details: Orange Wave 3 appears complete, with Orange Wave 4 now unfolding.
The USDJPY 4-Hour Chart also aligns with Elliott Wave theory, indicating that the market is in a corrective phase, a counter-trend movement within a larger wave structure. The current structure, Orange Wave 4, follows the impulsive Orange Wave 3 and typically signifies a retracement before resuming the overall trend.
The market is in the early stages of a new cycle, marked by Navy Blue Wave 1, which sets the foundation for upcoming movements. After Orange Wave 4 concludes its corrective action, the next anticipated move is toward Orange Wave 5, continuing the upward trend.
The analysis highlights that Orange Wave 3 has likely ended, leading to the current corrective phase of Orange Wave 4. Once this phase completes, the chart suggests a bullish move into Orange Wave 5, which will finalize the broader wave sequence.
Key Takeaways:
- The USDJPY 4-Hour Chart is in Orange Wave 4, a corrective phase after Orange Wave 3.
- Navy Blue Wave 1 indicates the start of a new cycle.
- A bullish move into Orange Wave 5 is expected after the conclusion of Orange Wave 4, resuming the overall trend.
Technical Analyst: Malik Awais
Source: visit Tradinglounge.com and learn From the Experts Join TradingLounge Here
Previous: Euro/British Pound (EURGBP) Elliott Wave Technical Analysis
VALUE Offer - Buy 1 Month & Get 3 Months!Click here
Access 7 Analysts Over 200 Markets Covered. Chat Room With Support