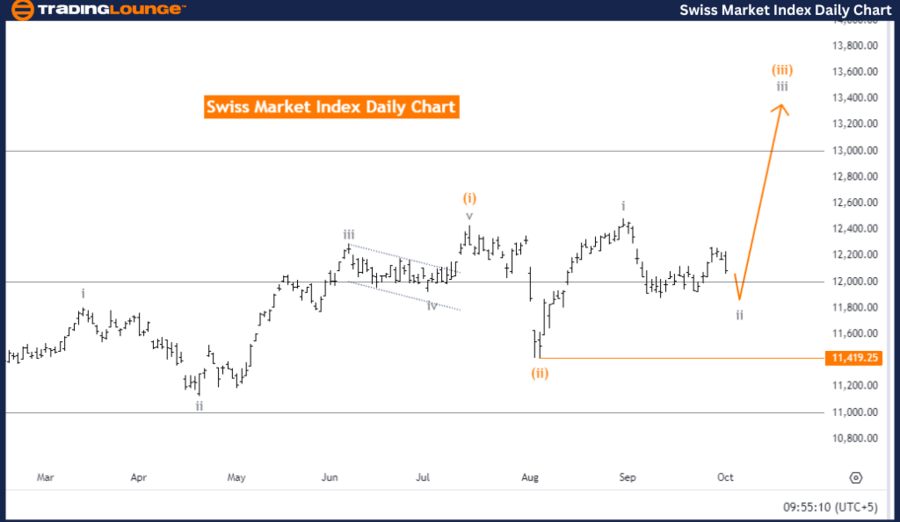
Swiss Market Index Elliott Wave Analysis – Trading Lounge Day Chart

Swiss Market Index Elliott Wave Technical Analysis

FUNCTION: Counter Trend

MODE: Corrective

STRUCTURE: Gray wave 2

POSITION: Orange wave 3

DIRECTION NEXT HIGHER DEGREES: Gray wave 3

DETAILS: Gray wave 1 is complete, and gray wave 2 is now active.

Wave Cancel Invalidation Level: 11,419.25

The Swiss Market Index (SMI) Elliott Wave Analysis for the daily chart reveals a counter-trend phase, indicating that the market is undergoing a temporary correction against the prevailing trend. This movement is categorized as corrective, signifying a retracement rather than a trend continuation. Currently, the focus is on gray wave 2, which follows the completion of gray wave 1.

At this point, the market is situated in orange wave 3 within the broader structure of gray wave 2. With gray wave 1 completed, the market is now retracing some of its previous gains. In Elliott Wave Theory, wave 2 often corrects part of wave 1’s rise, meaning this correction is likely temporary. Once gray wave 2 concludes, the market is expected to resume the main trend.

The next anticipated movement in the higher degree is gray wave 3, which typically signifies an impulsive wave. This indicates that, once the corrective phase of gray wave 2 finishes, the market is poised for a significant upward move.

A critical level to watch is the invalidation point at 11,419.25. Should the market drop below this, the current analysis will no longer be valid, signaling the need for a revised wave count. It’s crucial for traders to monitor this level closely.

Summary:
The SMI Elliott Wave Analysis for the daily chart suggests a counter-trend correction with gray wave 2 currently unfolding. Traders should keep an eye on the 11,419.25 invalidation level to determine if the analysis remains valid. Once gray wave 2 concludes, a stronger upward trend, led by gray wave 3, is expected.

Swiss-Market-Index-D...


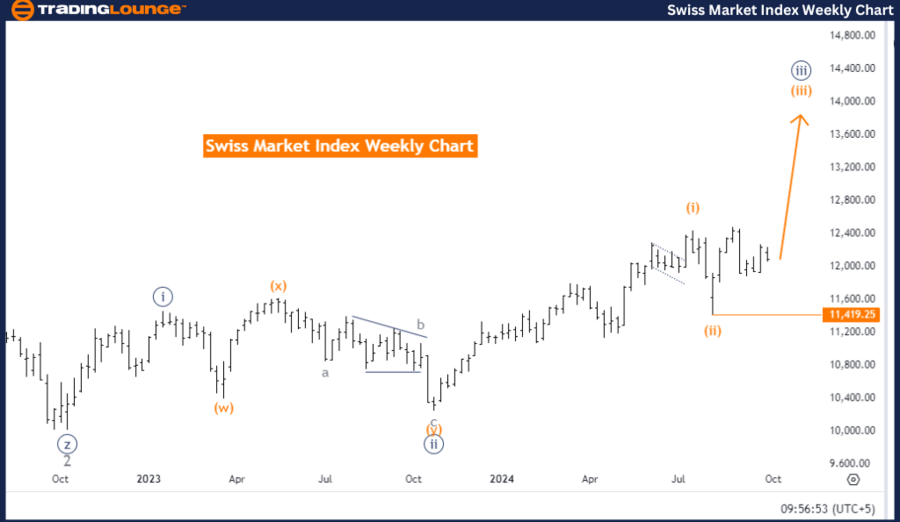
Swiss Market Index Elliott Wave Analysis – Trading Lounge Weekly Chart

Swiss Market Index Elliott Wave Technical Analysis

FUNCTION: Bullish Trend

MODE: Impulsive

STRUCTURE: Orange wave 3

POSITION: Navy blue wave 3

DIRECTION NEXT HIGHER DEGREES: Orange wave 3 (active)

DETAILS: Orange wave 2 has finished, and orange wave 3 has commenced.

Wave Cancel Invalidation Level: 11,419.25

The Swiss Market Index (SMI) Elliott Wave Analysis for the weekly chart shows a clear bullish trend, indicating strong upward momentum. The current market mode is impulsive, meaning the trend is firmly in place and the market is advancing. The structure under analysis is orange wave 3, a key element in this bullish phase.

The market is currently positioned in navy blue wave 3, part of the larger orange wave 3 structure. With orange wave 2 completed, the market is now moving into the more powerful wave 3 stage. According to Elliott Wave Theory, wave 3 is often the longest and strongest in an impulsive sequence, suggesting further substantial upward movement as the wave progresses.

The next expected movement is a continuation of orange wave 3, which has just begun. Since wave 3 is typically the most dynamic phase in the Elliott Wave sequence, the market is likely to experience significant gains before any corrective action.

The key invalidation level is 11,419.25. A drop below this point would invalidate the current wave structure and necessitate a reassessment. Maintaining above this level confirms the bullish trend's strength.

Summary:
The weekly chart of the SMI Elliott Wave Analysis highlights a robust bullish trend, with orange wave 3 leading the market upward. Traders should keep a close watch on the 11,419.25 invalidation level to confirm the continued strength of the bullish move. The upward momentum is expected to remain strong as orange wave 3 progresses.

Technical Analyst: Malik Awais

Source: visit Tradinglounge.com and learn From the Experts Join TradingLounge Here 

Previous: Hang Seng Index Elliott Wave Technical Analysis

VALUE Offer - Buy 1 Month & Get 3 Months!Click here

Access 7 Analysts Over 200 Markets Covered. Chat Room With Support

Swiss-Market-Index-W...

Related

Detailed Elliott Wave Analysis of ASX Sonic Healthcare Limited (SHL) with Stock Forecasts, Price Targets, and Market Predictions

Detailed Elliott Wave Analysis of ASX Sonic Healthcare Limited (SHL) with Stock Forecasts, Price Targets, and Market Predictions

This detailed Elliott Wave analysis of ASX Sonic Healthcare Limited (SHL) provides insights into the...

Read More >
Anticipate the Forex Market Movements for the Australian Dollar against the U.S. Dollar: AUDUSD Elliott Wave Technical Analysis

Anticipate the Forex Market Movements for the Australian Dollar against the U.S. Dollar: AUDUSD Elliott Wave Technical Analysis

This analysis covers the AUDUSD pair using Elliott Wave theory, providing key insights into current ...

Read More >
THETA Token/ U.S. dollar(THETAUSD) Elliott Wave Technical Analysis 4 December 23

THETA Token/ U.S. dollar(THETAUSD) Elliott Wave Technical Analysis 4 December 23

THETA Token and U.S. dollar(THETAUSD) Elliott Wave Technical Analysis dated 4 December 23, TradingLo...

Read More >
NASDAQ Stock Market Update: Key Insights on AAPL, TSLA, AMZN, and More as Earnings Week Approaches

NASDAQ Stock Market Update: Key Insights on AAPL, TSLA, AMZN, and More as Earnings Week Approaches

The text provides an Elliott Wave analysis of the NASDAQ stock market, focusing on major indices lik...

Read More >
Our Insights Cover Wave Patterns, and Market Trends: Australian Dollar/U.S.Dollar (AUDUSD) Forex Elliott Wave Technical Analysis

Our Insights Cover Wave Patterns, and Market Trends: Australian Dollar/U.S.Dollar (AUDUSD) Forex Elliott Wave Technical Analysis

Discover the most comprehensive AUDUSD Elliott Wave analysis and Forex trading strategies. Our exper...

Read More >
Learn about the best S&P/ASX 200 stocks, index funds, and ETFs: S&P/ASX 200 Index Elliott Wave Technical Analysis

Learn about the best S&P/ASX 200 stocks, index funds, and ETFs: S&P/ASX 200 Index Elliott Wave Technical Analysis

Discover in-depth S&P/ASX 200 trading insights, featuring Elliott Wave analysis, market forecasts, a...

Read More >
Detailed Elliott Wave Analysis of ASX Sonic Healthcare Limited (SHL) with Stock Forecasts, Price Targets, and Market Predictions

Detailed Elliott Wave Analysis of ASX Sonic Healthcare Limited (SHL) with Stock Forecasts, Price Targets, and Market Predictions

This detailed Elliott Wave analysis of ASX Sonic Healthcare Limited (SHL) provides insights into the...

Read More >
Anticipate the Forex Market Movements for the Australian Dollar against the U.S. Dollar: AUDUSD Elliott Wave Technical Analysis

Anticipate the Forex Market Movements for the Australian Dollar against the U.S. Dollar: AUDUSD Elliott Wave Technical Analysis

This analysis covers the AUDUSD pair using Elliott Wave theory, providing key insights into current ...

Read More >
THETA Token/ U.S. dollar(THETAUSD) Elliott Wave Technical Analysis 4 December 23

THETA Token/ U.S. dollar(THETAUSD) Elliott Wave Technical Analysis 4 December 23

THETA Token and U.S. dollar(THETAUSD) Elliott Wave Technical Analysis dated 4 December 23, TradingLo...

Read More >
NASDAQ Stock Market Update: Key Insights on AAPL, TSLA, AMZN, and More as Earnings Week Approaches

NASDAQ Stock Market Update: Key Insights on AAPL, TSLA, AMZN, and More as Earnings Week Approaches

The text provides an Elliott Wave analysis of the NASDAQ stock market, focusing on major indices lik...

Read More >
Our Insights Cover Wave Patterns, and Market Trends: Australian Dollar/U.S.Dollar (AUDUSD) Forex Elliott Wave Technical Analysis

Our Insights Cover Wave Patterns, and Market Trends: Australian Dollar/U.S.Dollar (AUDUSD) Forex Elliott Wave Technical Analysis

Discover the most comprehensive AUDUSD Elliott Wave analysis and Forex trading strategies. Our exper...

Read More >
Learn about the best S&P/ASX 200 stocks, index funds, and ETFs: S&P/ASX 200 Index Elliott Wave Technical Analysis

Learn about the best S&P/ASX 200 stocks, index funds, and ETFs: S&P/ASX 200 Index Elliott Wave Technical Analysis

Discover in-depth S&P/ASX 200 trading insights, featuring Elliott Wave analysis, market forecasts, a...

Read More >

Buy 1 Month

Get 3 Months!

Special Offer:

Trade Recommendations

Unleash the power of deversified trading with our comprehensive portfolio, covering:

  • Stock Trades
  • Crypto Trades
  • Forex Trades
  • Commodity Trades
Elliott Wave Analysis

Gain a competive edge with expert insights in to:

  • Global Indices
  • US Stocks & ASX Stocks
  • Forex & Crypto
  • Commodities
Top-Notch Trading Tools

Equip yourself with the tools of success:

  • Social Chat
  • Elliott Wave Algorithm
  • Screener
  • TradingLevels
  • Trading Game
7 Elliott Wave Analysts

Stay ahead of the market with daily charts and insightful videos
-Your secret to strategic trading!

JOIN HERE


Welcome to TradingLounge (ASIC A.R.No. 321187), specialists in trades, trading education and technical analysis, covering stocks, indices, commodities, forex and cryptocurrencies.

When you join TradingLounge you have access to everything we offer, including trade tools, educational content and a social platform to chat with like-minded investors.

Read more

@Copyright 2024 by tradinglounge.com

Contact Us

Australian no: 02 4787 6020

International no: +61 (2) 47876020

Pay with:

Find us on