NEE Elliott Wave Analysis: NextEra Energy Inc. (NEE) Daily and 1-Hour Chart Structures

This Elliott Wave analysis of NextEra Energy Inc. (NEE) highlights the current trends and potential future price movements based on both daily and 1-hour chart structures.

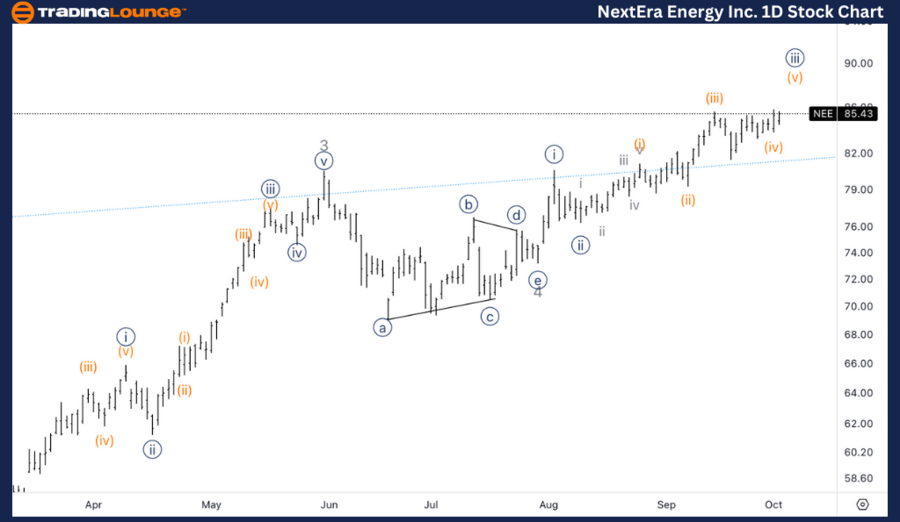
NEE Elliott Wave Analysis - Trading Lounge Daily Chart

NextEra Energy Inc. (NEE) Daily Chart

NEE Elliott Wave Technical Analysis

Function: Trend

Mode: Impulsive

Structure: Motive

Position: Wave 5

Direction: Upside in {iii} of 5

We are currently observing the potential for further upside in Wave 5, with an estimated target around $100, as the stock is now trading above the key level of $80 (TradingLevel8).

NEE Stock Technical Analysis – Daily Chart

On the daily chart, NextEra Energy (NEE) is progressing within an impulsive motive wave, particularly in Wave 5. The stock is trending upward within Wave {iii} of 5, and with the current price exceeding TradingLevel8 at $80, the next upside target for Wave 5 is approximately $100.

This price level is significant, as the stock has demonstrated strong bullish momentum, successfully surpassing key resistance points. Traders should monitor for continued upward movement, particularly as the price approaches the psychological level of $100.

NextEra-Energy-Inc-1...


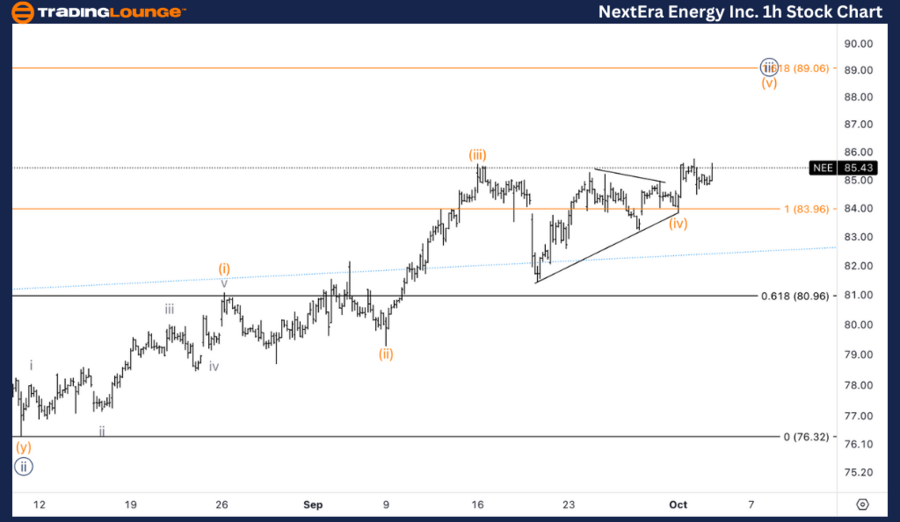
NextEra Energy Inc. (NEE) 1-Hour Chart Analysis

NEE Elliott Wave Technical Analysis

Function: Trend

Mode: Impulsive

Structure: Motive

Position: Wave (v) of {iii}

Direction: Upside in Wave (v)

We are looking for upside potential in Wave (v), following the breakout from a triangle pattern in Wave (iv). The 1.618 Fibonacci extension of {iii} vs. {i} is positioned around $89, presenting a possible upside target. Additionally, $88 could be seen as a profit-taking level due to its proximity to the Fibonacci target.

NEE Technical Analysis – 1-Hour Chart

On the 1-hour chart, NEE is in the final stages of Wave (v) of {iii}, having recently broken out of the triangle pattern formed during Wave (iv). The next target for Wave (v) is around $89, which aligns with the 1.618 Fibonacci extension of {iii} vs. {i}. Furthermore, the $88 level may serve as a potential profit-taking point due to its closeness to the Fibonacci extension target.

With the triangle breakout and ongoing upside momentum, NEE is expected to experience further gains in the short term, especially as it approaches $89, the next key resistance level.

Technical Analyst: Alessio Barretta

Source: visit Tradinglounge.com and learn From the Experts Join TradingLounge Here 

See Previous: Caterpillar Inc. (CAT) Elliott Wave Technical Analysis

VALUE Offer - Buy 1 Month & Get 3 Months!Click here

Access 7 Analysts Over 200 Markets Covered. Chat Room With Support

NextEra-Energy-Inc-1...

Related

Elliott Wave Technical analysis of PayPal Holdings Inc. (PYPL) Stock Highlighting the Current Market Structure and Movements

Elliott Wave Technical analysis of PayPal Holdings Inc. (PYPL) Stock Highlighting the Current Market Structure and Movements

This article provides a comprehensive Elliott Wave analysis of PayPal Holdings Inc. (PYPL), highligh...

Read More >
Detailed Insights into the Palo Alto Networks Inc.Stock Performance: PANW Stocks Elliott Wave Technical Analysis

Detailed Insights into the Palo Alto Networks Inc.Stock Performance: PANW Stocks Elliott Wave Technical Analysis

Our latest Elliott Wave analysis of Palo Alto Networks Inc. (PANW) offers detailed insights into the...

Read More >
Expert Elliott Wave Technical Analysis for ASX: REA GROUP LTD – Accurate Stock Forecasts and Winning Trading Strategies

Expert Elliott Wave Technical Analysis for ASX: REA GROUP LTD – Accurate Stock Forecasts and Winning Trading Strategies

Explore the comprehensive Elliott Wave analysis for ASX: REA GROUP LTD. This article provides an in-...

Read More >
Netflix Inc. (NFLX) Stock Analysis: An Elliottwave Technical analysis Perspective

Netflix Inc. (NFLX) Stock Analysis: An Elliottwave Technical analysis Perspective

This article provides an in-depth Elliott Wave analysis of Netflix Inc. (NFLX) stock, offering a det...

Read More >
Elliott Wave Analysis for JP Morgan & Chase Co. (JPM), Focusing on Both Saily and 1-Hour Charts, Highlights Key Trading Levels

Elliott Wave Analysis for JP Morgan & Chase Co. (JPM), Focusing on Both Saily and 1-Hour Charts, Highlights Key Trading Levels

This article provides a comprehensive Elliott Wave analysis for JP Morgan & Chase Co. (JPM), focusin...

Read More >

Buy 1 Month

Get 3 Months!

Special Offer:

Trade Recommendations

Unleash the power of deversified trading with our comprehensive portfolio, covering:

  • Stock Trades
  • Crypto Trades
  • Forex Trades
  • Commodity Trades
Elliott Wave Analysis

Gain a competive edge with expert insights in to:

  • Global Indices
  • US Stocks & ASX Stocks
  • Forex & Crypto
  • Commodities
Top-Notch Trading Tools

Equip yourself with the tools of success:

  • Social Chat
  • Elliott Wave Algorithm
  • Screener
  • TradingLevels
  • Trading Game
7 Elliott Wave Analysts

Stay ahead of the market with daily charts and insightful videos
-Your secret to strategic trading!

JOIN HERE


Welcome to TradingLounge (ASIC A.R.No. 321187), specialists in trades, trading education and technical analysis, covering stocks, indices, commodities, forex and cryptocurrencies.

When you join TradingLounge you have access to everything we offer, including trade tools, educational content and a social platform to chat with like-minded investors.

Read more

@Copyright 2024 by tradinglounge.com

Contact Us

Australian no: 02 4787 6020

International no: +61 (2) 47876020

Pay with:

Find us on