MCD Elliott Wave Analysis: McDonald’s Corp. (MCD) - Daily and 1-Hour Charts

This analysis examines McDonald's Corp. (MCD) from both the daily and 1-hour chart perspectives, applying Elliott Wave Theory to identify current trends and predict future price movements.

MCD Elliott Wave Analysis – Tradinglounge Daily Chart

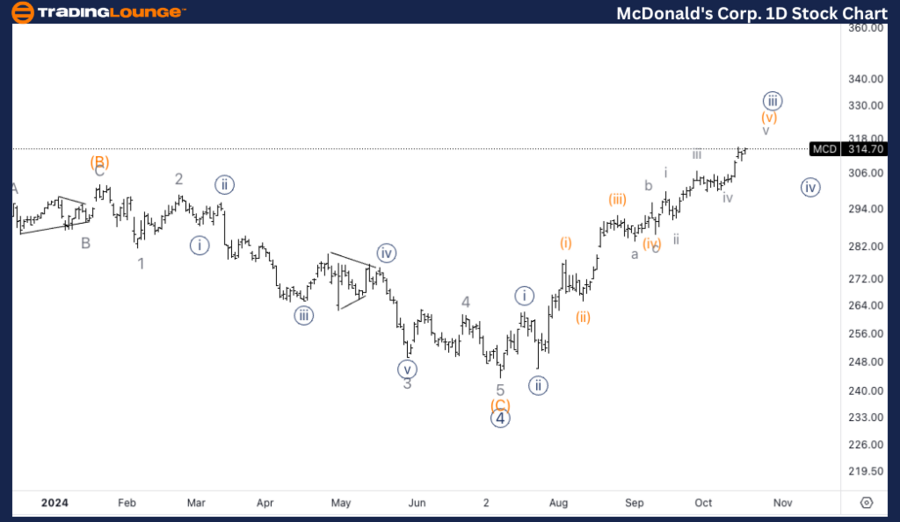
McDonald’s Corp. (MCD) Daily Chart

MCD Elliott Wave Technical Analysis

Function: Trend

Mode: Impulsive

Structure: Motive

Position: Wave 1 of (1)

Direction: Upside

Details: The daily chart shows McDonald's in Wave 1 of (1), signaling the start of an impulsive move after a prolonged correction in Primary Wave 4. This correction seems to have bottomed, leading to a strong upside movement. This marks the early stages of a new bullish phase, with further upside potential as Wave 1 continues to develop.

MCD Stock Technical Analysis – Daily Chart Overview

McDonald’s has entered a bullish phase in Wave 1 of (1) after completing a lengthy correction in Primary Wave 4. The daily chart suggests a strong upside thrust as this new impulsive wave unfolds. Traders should watch for further upward momentum as Wave 1 progresses.

McDonalds-Corp-1D-St...


MCD Elliott Wave Analysis – 1-Hour Chart

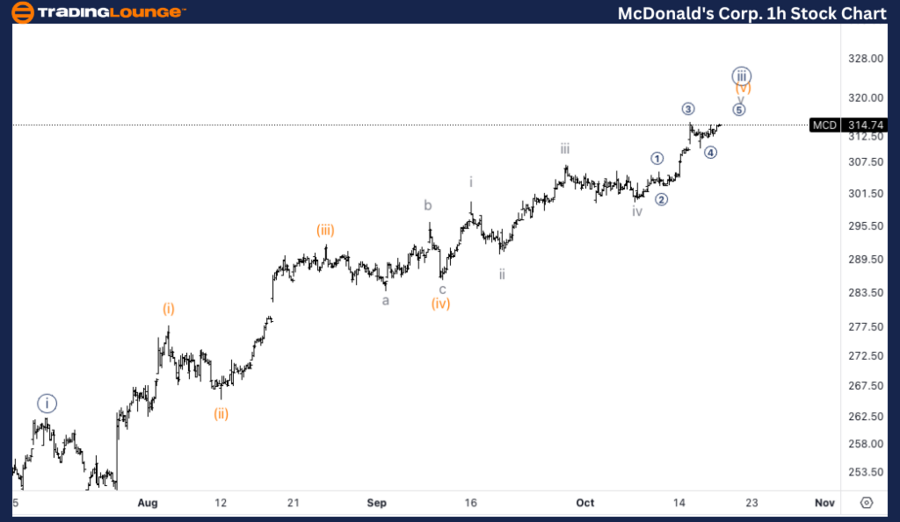
McDonald’s Corp. (MCD) 1-Hour Chart

MCD Technical Analysis

Function: Trend

Mode: Impulsive

Structure: Motive

Position: Wave {iii} of 1

Direction: Upside

Details: The 1-hour chart shows McDonald's in Wave {iii} of 1, with further upside likely. This subdivision of Minute Wave {iii} suggests that the wave is nearing a potential top, likely around the middle of MinorGroup1, near the $320 level. After this peak, a brief corrective phase may occur before resuming the broader bullish trend.

MCD Chart Technical Analysis – 1-Hour Chart Overview

Wave {iii} of 1 in McDonald's 1-hour chart appears to be approaching a top around the $320 mark. Once this top is reached, traders can anticipate a small corrective phase before the bullish trend continues. Keep an eye on the price action near this level for potential short-term pullbacks.

Technical Analyst: Alessio Barretta

Source: visit Tradinglounge.com and learn From the Experts Join TradingLounge Here 

See Previous: Deere & Co. (DE) Elliott Wave Technical Analysis

VALUE Offer - Buy 1 Month & Get 3 Months!Click here

Access 7 Analysts Over 200 Markets Covered. Chat Room With Support

McDonalds-Corp-1H-St...

Related

The Procter & Gamble Company (PG) Elliott Wave Technical Analysis 9 February 24

The Procter & Gamble Company (PG) Elliott Wave Technical Analysis 9 February 24

Delve into the world of trading with a comprehensive analysis of Procter & Gamble (PG) stock using E...

Read More >
Understand the JPM stock forecast and price movements with JP Morgan & Chase Co. Stocks Elliott Wave Technical Analysis

Understand the JPM stock forecast and price movements with JP Morgan & Chase Co. Stocks Elliott Wave Technical Analysis

Explore our in-depth Elliott Wave analysis of JPMorgan Chase & Co. (JPM). Understand the current sto...

Read More >
ChainLink Crypto Price News Today: Elliott Wave Forecast & Effective Trading Strategies

ChainLink Crypto Price News Today: Elliott Wave Forecast & Effective Trading Strategies

This article provides a thorough analysis of ChainLink (LINKUSD) using Elliott Wave principles. It c...

Read More >
Explore our detailed U.S.Dollar/Japanese Yen(USDJPY) Forex Elliott Wave Technical Analysis

Explore our detailed U.S.Dollar/Japanese Yen(USDJPY) Forex Elliott Wave Technical Analysis

Explore our detailed USD/JPY Elliott Wave analysis, focusing on daily and 4-hour charts. Understand ...

Read More >
Diminishing Trading Volume Hints at Market Top Ahead of Tech Giants' Earnings

Diminishing Trading Volume Hints at Market Top Ahead of Tech Giants' Earnings

Over the past two months, trading volumes for the S&P 500 (SPX) and the NASDAQ 100 (NDX) have been d...

Read More >
Australian Dollar / Japanese Yen (AUDJPY) Forex Elliott Wave Technical Analysis: Insights and Predictions

Australian Dollar / Japanese Yen (AUDJPY) Forex Elliott Wave Technical Analysis: Insights and Predictions

Elliott Wave analysis of the AUDJPY currency pair, detailing both daily and 4-hour chart interpretat...

Read More >

Buy 1 Month

Get 3 Months!

Special Offer:

Trade Recommendations

Unleash the power of deversified trading with our comprehensive portfolio, covering:

  • Stock Trades
  • Crypto Trades
  • Forex Trades
  • Commodity Trades
Elliott Wave Analysis

Gain a competive edge with expert insights in to:

  • Global Indices
  • US Stocks & ASX Stocks
  • Forex & Crypto
  • Commodities
Top-Notch Trading Tools

Equip yourself with the tools of success:

  • Social Chat
  • Elliott Wave Algorithm
  • Screener
  • TradingLevels
  • Trading Game
7 Elliott Wave Analysts

Stay ahead of the market with daily charts and insightful videos
-Your secret to strategic trading!

JOIN HERE


Welcome to TradingLounge (ASIC A.R.No. 321187), specialists in trades, trading education and technical analysis, covering stocks, indices, commodities, forex and cryptocurrencies.

When you join TradingLounge you have access to everything we offer, including trade tools, educational content and a social platform to chat with like-minded investors.

Read more

@Copyright 2024 by tradinglounge.com

Contact Us

Australian no: 02 4787 6020

International no: +61 (2) 47876020

Pay with:

Find us on