ADANI POWER Elliott Wave Analysis TradingLounge 1D Chart

ADANI POWER 1 Day Chart Analysis

Adani Power Elliott Wave Technical Analysis

Function: Counter Trend (Intermediate degree, orange)

Mode: Corrective

Structure: Potential Impulse within Larger Degree Zigzag

Position: Minute Wave ((iii)) Navy

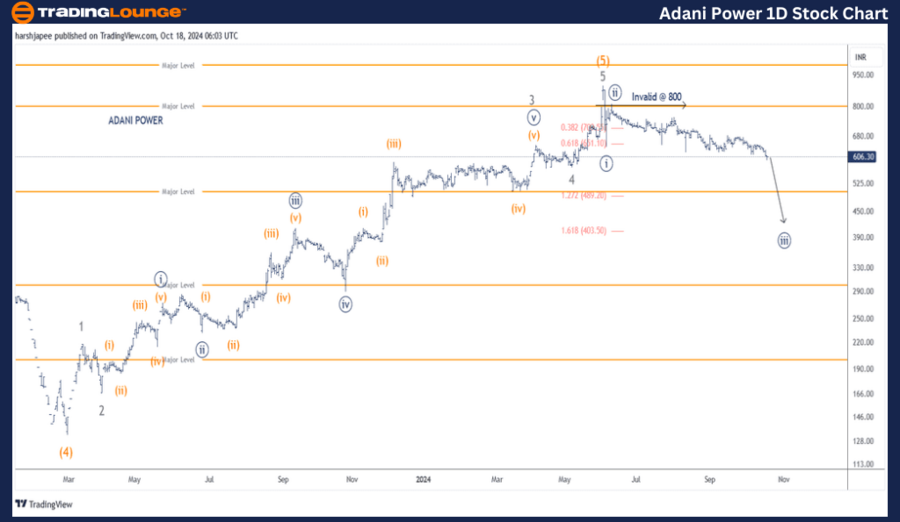
Details: Minute Wave ((iii)) Navy is moving lower within Minor Wave 1, targeting levels below 800. A confirmed break under 580 could push the price towards the 490-500 zone.

Invalidation point: 800

ADANI Power Daily Chart Technical Analysis and Elliott Wave Count Overview:

The daily chart for ADANI Power indicates the stock may have completed a bullish progression near the 900 level, coinciding with the termination of a fifth wave at multiple degrees. If accurate, a corrective drop at the Minor degree is expected to unfold below the 900 resistance.

Intermediate Wave (4) Orange was likely completed around 130 in February 2023. Since then, Minor Waves 1 to 5 appear to have finished, potentially marking the end of Intermediate Wave (5) Orange near the 900 range. The extension in Minor Wave 3 followed expectations.

If this analysis holds, ADANI Power should ideally remain under the 900 level, and more precisely below 800, maintaining the counter trend bias. The stock is projected to continue falling, with Minute Wave ((iii)) likely heading towards at least the 500 region.

Adani-Power-1D-Stock...


ADANI POWER Elliott Wave Technical Analysis (4H Chart)

ADANI POWER Elliott Wave Analysis

Function: Counter Trend (Intermediate degree, orange)

Mode: Corrective

Structure: Potential Impulse within Larger Degree Zigzag

Position: Minute Wave ((iii)) Navy

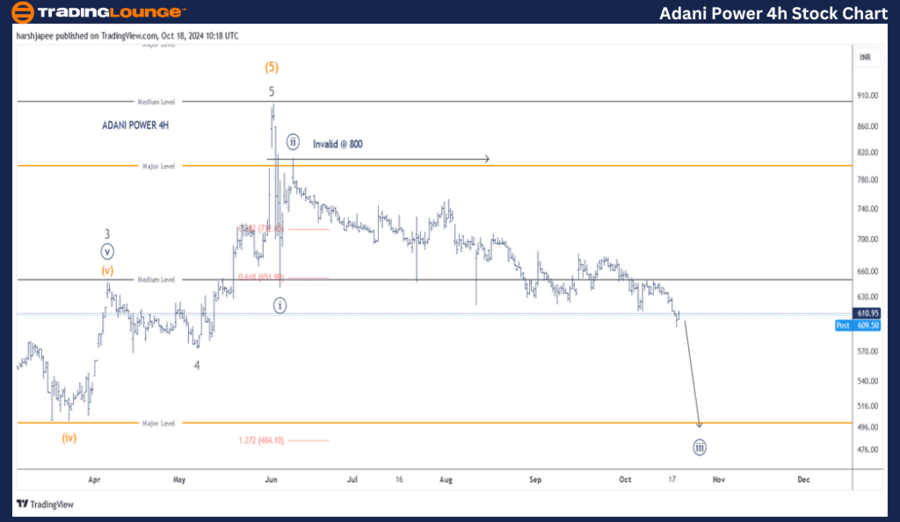
Details: Minute Wave ((iii)) Navy is currently declining within Minor Wave 1, against resistance at 800. If the stock breaks below 580, it could accelerate toward the 490-500 area. Alternatively, the stock might see a temporary bounce from 580, forming Minor Wave 4, before continuing higher.

Invalidation point: 800

ADANI Power 4H Chart Technical Analysis and Elliott Wave Count Overview:

The 4H chart for ADANI Power shows a major high formed near the 900 level. The stock is now in the midst of a larger corrective wave, with Minute Waves ((i)) and ((ii)) completing around 645 and 800, respectively. Minute Wave ((iii)) appears to be in progress, potentially pushing the price lower towards 500.

Technical Analyst: Harsh Japee

Source: visit Tradinglounge.com and learn From the Experts Join TradingLounge Here 

Previous: TITAN Company Elliott Wave Technical Analysis

VALUE Offer - Buy 1 Month & Get 3 Months!Click here

Access 7 Analysts Over 200 Markets Covered. Chat Room With Support

Adani-Power-4h-Stock...


Conclusion:

ADANI Power may have reversed from its highs at 900 and is now advancing within Minute Wave ((iii)) Navy, with a target around the 500 level in the upcoming sessions.

Related

Strategies for Forex Traders aiming to Capitalize on the EURUSD Market Trends: Euro/ U.S. Dollar Elliott Wave Technical Analysis

Strategies for Forex Traders aiming to Capitalize on the EURUSD Market Trends: Euro/ U.S. Dollar Elliott Wave Technical Analysis

This comprehensive analysis provides an in-depth look at the EURUSD using Elliott Wave Theory. Disco...

Read More >
Gold (XAUUSD) Commodity Elliott Wave Technical Analysis: Find Out what to Expect From the Next Pullback and How to Navigate

Gold (XAUUSD) Commodity Elliott Wave Technical Analysis: Find Out what to Expect From the Next Pullback and How to Navigate

This analysis dives into Gold's Elliott Wave structure, examining both daily and H4 chart patter...

Read More >
Thoroughly Analyses the CAC 40, Featuring Elliott Wave Insights, Technical Analysis, and Forecasts: CAC 40 Trading Strategies

Thoroughly Analyses the CAC 40, Featuring Elliott Wave Insights, Technical Analysis, and Forecasts: CAC 40 Trading Strategies

This article thoroughly analyses the CAC 40, featuring Elliott Wave insights, technical analysis, an...

Read More >
U.S.Dollar /Canadian Dollar(USD/CAD) Elliott Wave Technical Analysis 7 November 23

U.S.Dollar /Canadian Dollar(USD/CAD) Elliott Wave Technical Analysis 7 November 23

The "USD/CAD Elliott Wave Analysis Trading Lounge Day Chart" for 7 November 23, provides a...

Read More >
In-depth insights into S&P/ASX 200 Index Elliott Wave Technical Analysis: Trading and Investing with Our Comprehensive Guide

In-depth insights into S&P/ASX 200 Index Elliott Wave Technical Analysis: Trading and Investing with Our Comprehensive Guide

Discover in-depth insights into S&P/ASX 200 trading and investing with our comprehensive guide. Lear...

Read More >
GX Uranium ETF (URA) Elliott Wave Technical Analysis: Unlocking Opportunities

GX Uranium ETF (URA) Elliott Wave Technical Analysis: Unlocking Opportunities

Delve into GX Uranium ETF's market dynamics through Elliott Wave Analysis, offering insights int...

Read More >

Buy 1 Month

Get 3 Months!

Special Offer:

Trade Recommendations

Unleash the power of deversified trading with our comprehensive portfolio, covering:

  • Stock Trades
  • Crypto Trades
  • Forex Trades
  • Commodity Trades
Elliott Wave Analysis

Gain a competive edge with expert insights in to:

  • Global Indices
  • US Stocks & ASX Stocks
  • Forex & Crypto
  • Commodities
Top-Notch Trading Tools

Equip yourself with the tools of success:

  • Social Chat
  • Elliott Wave Algorithm
  • Screener
  • TradingLevels
  • Trading Game
7 Elliott Wave Analysts

Stay ahead of the market with daily charts and insightful videos
-Your secret to strategic trading!

JOIN HERE


Welcome to TradingLounge (ASIC A.R.No. 321187), specialists in trades, trading education and technical analysis, covering stocks, indices, commodities, forex and cryptocurrencies.

When you join TradingLounge you have access to everything we offer, including trade tools, educational content and a social platform to chat with like-minded investors.

Read more

@Copyright 2024 by tradinglounge.com

Contact Us

Australian no: 02 4787 6020

International no: +61 (2) 47876020

Pay with:

Find us on