14Nov

TASI Index Elliott Wave Technical Analysis: Daily and Weekly Charts, Offering Insights and Strategies for the Saudi Stock Market

TASI Index Elliott Wave Analysis – Trading Lounge Day Chart

TASI Index Elliott Wave Technical Analysis

  • Function: Bullish Trend

  • Mode: Impulsive

  • Structure: Gray wave 3

  • Position: Orange wave 3

  • Direction Next Lower Degrees: Gray wave 4

  • Details: Gray wave 2 is complete. Gray wave 3 is now active.

  • Wave Cancel Invalid Level: 11324.751

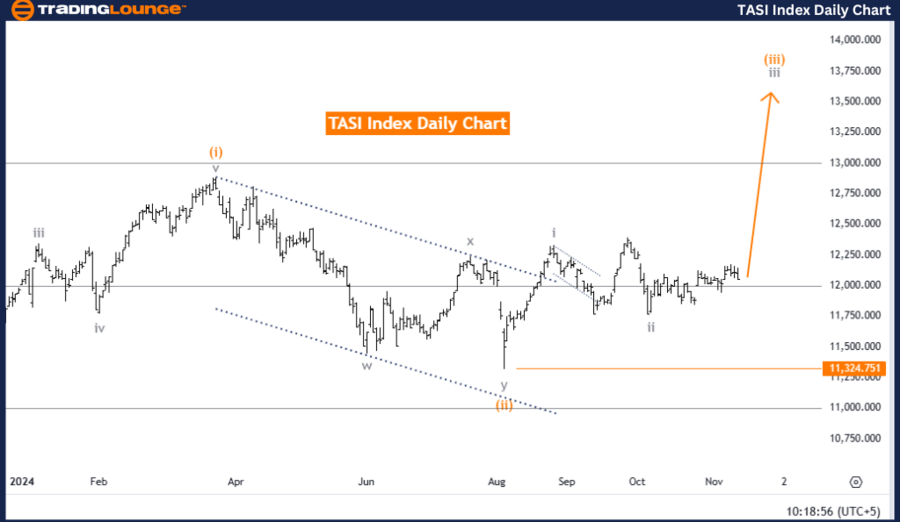
The Elliott Wave analysis for the TASI Index daily chart provided by Trading Lounge emphasizes a bullish trend, currently moving in an impulsive wave pattern. The active wave is identified as gray wave 3, which demonstrates strong upward momentum and resides within orange wave 3, aligning with a broader bullish sentiment for the index.

With the completion of gray wave 2, the market has transitioned into gray wave 3, often characterized by the most substantial momentum within the Elliott Wave structure. As gray wave 3 progresses within orange wave 3, it signals a continuation of positive price movement, further confirming the bullish trend.

A critical invalidation level at 11324.751 acts as a key threshold for traders. A decline to or below this level would invalidate the current Elliott Wave analysis, signaling a potential end to the bullish trend. This may indicate a corrective phase or a reversal, necessitating a re-assessment of the overall market structure.

Summary

  • Bullish Outlook: Gray wave 3 is driving upward momentum within orange wave 3.
  • Key Level: Monitor the invalidation point at 11324.751. A drop below this level could challenge the bullish trend, signaling a potential reversal or market correction.

TASI-Index-Daily-Cha...


TASI Index Elliott Wave Analysis – Trading Lounge Weekly Chart

TASI Index Elliott Wave Technical Analysis

  • Function: Bullish Trend

  • Mode: Impulsive

  • Structure: Orange wave 3

  • Position: Navy blue wave 3

  • Direction Next Lower Degrees: Orange wave 4

  • Details: Orange wave 2 is complete. Orange wave 3 is now active.

  • Wave Cancel Invalid Level: 11324.751

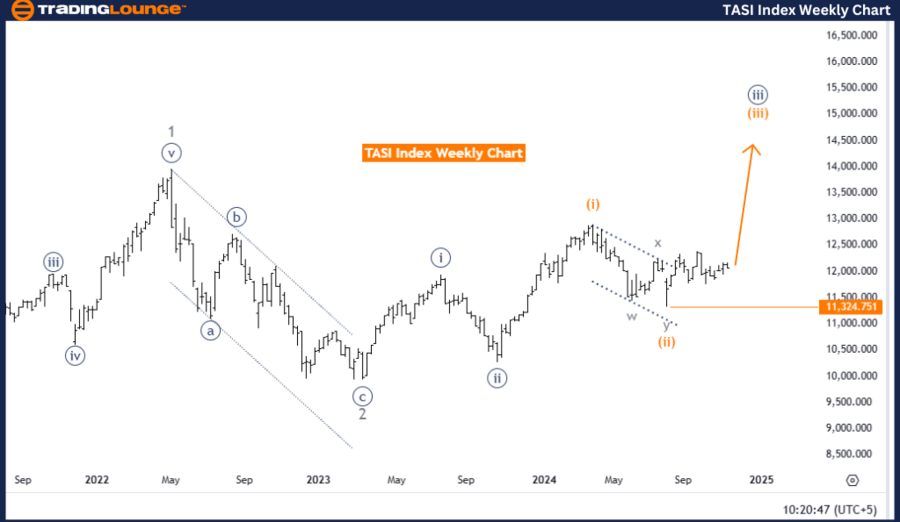
The TASI Index weekly chart analysis from Trading Lounge highlights a bullish trend supported by an impulsive wave structure. The current development of orange wave 3 within the larger framework of navy blue wave 3 reflects sustained upward momentum, further solidifying the positive outlook for the index.

With the completion of orange wave 2, the market has moved into orange wave 3, a pivotal phase in the Elliott Wave cycle. This wave is often the most dynamic and characterized by significant upward price movement. The alignment within navy blue wave 3 strengthens the bullish case, indicating potential for further price appreciation as orange wave 3 unfolds.

The invalidation level of 11324.751 remains a crucial point for this analysis. A decline to or below this threshold would negate the current wave structure and could indicate a shift in trend or the beginning of a corrective phase. This level serves as a key reference for traders to monitor the strength and sustainability of the ongoing bullish trend.

Summary

  • Bullish Trajectory: Orange wave 3 is advancing within the larger navy blue wave 3 framework.
  • Key Level: The invalidation point at 11324.751 is critical for validating the bullish structure. A drop below this level would prompt re-evaluation and could signal a reversal or market correction.

Technical Analyst: Malik Awais

Source: visit Tradinglounge.com and learn From the Experts Join TradingLounge Here 

Previous: NIKKEI 225 Elliott Wave Technical Analysis 

VALUE Offer - Buy 1 Month & Get 3 Months!Click here

Access 7 Analysts Over 200 Markets Covered. Chat Room With Support

TASI-Index-Weekly-Ch...

Related

Unveiling Dynamics EURUSD's Elliott Wave Technical Analysis: Navigating Impulsive Trends

Unveiling Dynamics EURUSD's Elliott Wave Technical Analysis: Navigating Impulsive Trends

In the analysis of the Euro/U.S. Dollar (EURUSD) currency pair through Elliott Wave principles on bo...

Read More >
NEOUSD Elliott Wave Technical Analysis: Where we break down NEO's Price Movements, Trading Strategies, and Key Indicators

NEOUSD Elliott Wave Technical Analysis: Where we break down NEO's Price Movements, Trading Strategies, and Key Indicators

Explore the comprehensive NEOUSD Elliott Wave analysis, where we break down NEO's price movement...

Read More >
Meta Platforms Inc.(META:NYSE) Elliott Wave Technical Analysis 19 January 24

Meta Platforms Inc.(META:NYSE) Elliott Wave Technical Analysis 19 January 24

Meta Platforms Inc.(META: NASDAQ) Elliott Wave Technical Analysis dated 19 January 24. Meta Stock An...

Read More >
Boost your Trading with NIFTY 50 (INDIA) Elliott Wave Technical Analysis Help Market Prediction and the best Strategies

Boost your Trading with NIFTY 50 (INDIA) Elliott Wave Technical Analysis Help Market Prediction and the best Strategies

Stay ahead in the market with our comprehensive NIFTY 50 trading analysis. Utilizing Elliott Wave th...

Read More >
Euro Stoxx 50 Index Elliott Wave Technical Analysis Exhibits a Strong Bullish Trend on the Daily and Weekly Chart

Euro Stoxx 50 Index Elliott Wave Technical Analysis Exhibits a Strong Bullish Trend on the Daily and Weekly Chart

The Euro Stoxx 50 index exhibits a strong bullish trend on the weekly chart, with an impulsive Orang...

Read More >
VeChain/U.S. dollar(VETUSD) Elliott Wave Technical Analysis 24 October 23

VeChain/U.S. dollar(VETUSD) Elliott Wave Technical Analysis 24 October 23

VeChain/U.S. dollar(VETUSD) Elliott Wave Technical Analysis TradingLounge Daily Chart and 4-Hour Cha...

Read More >

Buy 1 Month

Get 3 Months!

Special Offer:

Trade Recommendations

Unleash the power of deversified trading with our comprehensive portfolio, covering:

  • Stock Trades
  • Crypto Trades
  • Forex Trades
  • Commodity Trades
Elliott Wave Analysis

Gain a competive edge with expert insights in to:

  • Global Indices
  • US Stocks & ASX Stocks
  • Forex & Crypto
  • Commodities
Top-Notch Trading Tools

Equip yourself with the tools of success:

  • Social Chat
  • Elliott Wave Algorithm
  • Screener
  • TradingLevels
  • Trading Game
7 Elliott Wave Analysts

Stay ahead of the market with daily charts and insightful videos
-Your secret to strategic trading!

JOIN HERE


Welcome to TradingLounge (ASIC A.R.No. 321187), specialists in trades, trading education and technical analysis, covering stocks, indices, commodities, forex and cryptocurrencies.

When you join TradingLounge you have access to everything we offer, including trade tools, educational content and a social platform to chat with like-minded investors.

Read more

@Copyright 2024 by tradinglounge.com

Contact Us

Australian no: 02 4787 6020

International no: +61 (2) 47876020

Pay with:

Find us on