25Oct

Euro/U.S.Dollar EURUSD Elliott Wave Technical Analysis 25 October 23

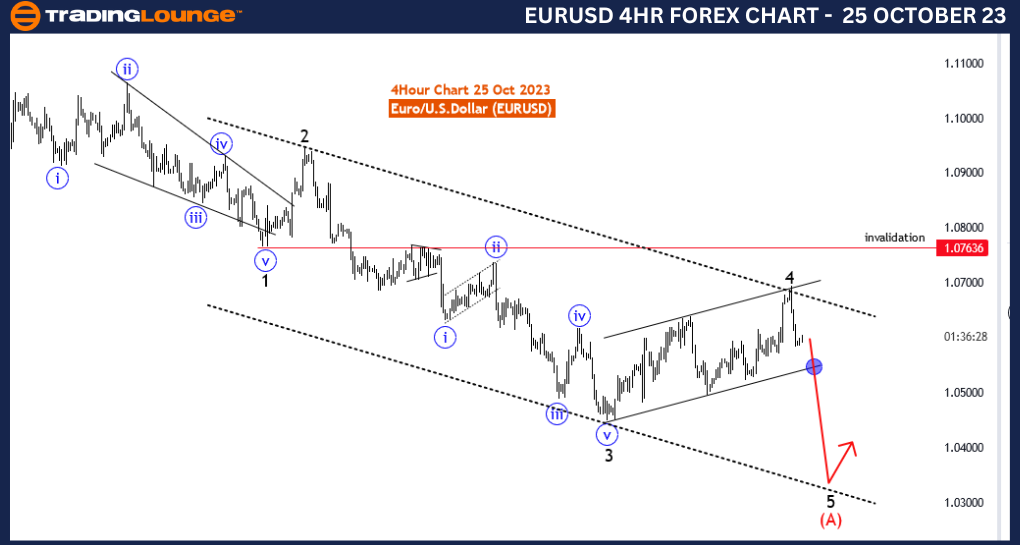
EURUSD Elliott Wave Analysis Trading Lounge 4 Hour  Chart, 25 October 23

Euro/U.S.Dollar(EURUSD) 4 Hour Chart

EURUSD Elliott Wave Technical Analysis

Function:  Counter Trend

Mode: impulsive  

Structure:5 of A

Position: wave 2

Direction Next lower Degrees: black wave 5 of A started

Details: black wave 4 completed at 1.06943 .Now wave 5 of A is in play . Wave Cancel invalid level: 1.07636

The EUR/USD Elliott Wave Analysis for the 4-hour chart on 25 October 23, provides valuable insights into potential price movements in the Euro/U.S. Dollar (EUR/USD) currency pair. This analysis is crucial for traders looking to navigate the complex forex market.

The analysis characterizes the function as "Counter Trend," indicating that the current price movement is against the dominant trend. This suggests that there may be a reversal or correction in progress, which is essential for traders to consider when making trading decisions.

The mode is described as "impulsive," signifying that the counter-trend move is forceful and significant. This implies that substantial price changes may be on the horizon. This information is particularly relevant to short- to medium-term traders.

The focus of the analysis is on the "5 of A" structure, representing a specific phase within the larger wave pattern. Understanding this wave structure is vital as it provides insights into potential trend reversals or corrections.

The report states that "black wave 4 completed at 1.06943" and that "wave 5 of A is in play." This means that the corrective phase, represented by black wave 4, has finished, and wave 5 of A, which is in the direction of the dominant trend, is currently unfolding. This phase is vital for traders to monitor as it may present trading opportunities in line with the prevailing trend.

The "Wave Cancel invalid level: 1.07636" serves as an essential reference point. It signifies the price level at which the described wave structure would be invalidated, indicating a potential shift in market dynamics.

In summary, the EUR/USD Elliott Wave Analysis for 25 October 23, is invaluable for traders interested in the EUR/USD currency pair. The completion of black wave 4 and the initiation of wave 5 of A suggest potential trading opportunities in the direction of the prevailing trend.

Traders should stay vigilant and be mindful of the provided invalidation level to manage risk effectively.

Technical Analyst: Malik Awais

Source: Tradinglounge.com get trial here!


EURUSD-4Hour-Forex-C...


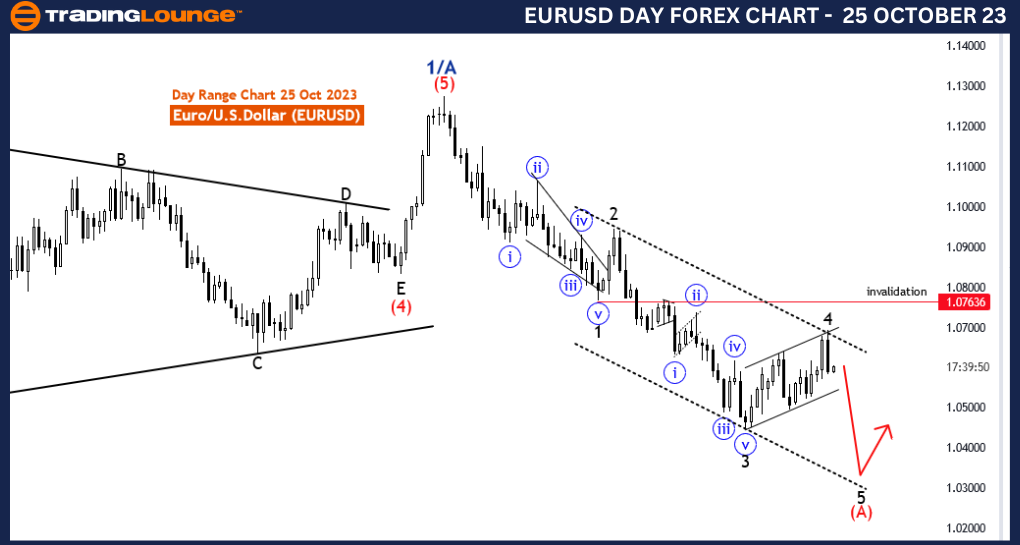
EURUSD Elliott Wave Analysis Trading Lounge Day  Chart, 25 October 23

Euro/U.S.Dollar(EURUSD) Day Chart

EURUSD Elliott Wave Technical Analysis

Function:  Counter Trend

Mode: impulsive  

Structure:5 of A

Position: wave 2

Direction Next Higher Degrees: red wave B

Details: black wave 4 completed at 1.06943 .Now wave 5 of A is in play . Wave Cancel invalid level: 1.07636

The EUR/USD Elliott Wave Analysis for the day chart on 25 October 23, provides essential insights into the potential movements of the Euro/U.S. Dollar (EUR/USD) currency pair. This analysis is crucial for traders navigating the complex forex market.

The analysis categorizes the function as "Counter Trend," suggesting that the current price movement opposes the prevailing trend. This implies that there might be a reversal or correction underway, a key consideration for traders.

Describing the mode as "impulsive" indicates that the counter-trend move is strong and significant, hinting at possible substantial price changes in the near future. This information is particularly pertinent for short- to medium-term traders.

The central focus of this analysis is on the "5 of A" structure, which represents a particular phase within the broader wave pattern. Understanding this wave structure is vital as it provides insights into potential trend reversals or corrections.

The report notes that "black wave 4 completed at 1.06943" and that "wave 5 of A is in play." This signifies that the corrective phase, denoted by black wave 4, has concluded, and wave 5 of A, which aligns with the dominant trend, is currently unfolding. This phase is crucial for traders to monitor as it may present trading opportunities in line with the prevailing trend.

The "Wave Cancel invalid level: 1.07636" serves as a crucial reference point. It represents the price level at which the described wave structure would be invalidated, signaling a potential shift in market dynamics.

In summary, the EUR/USD Elliott Wave Analysis for 23 October 23, is highly valuable for traders interested in the EUR/USD currency pair. The completion of black wave 4 and the initiation of wave 5 of A suggest potential trading opportunities in line with the prevailing trend.

Traders should remain vigilant and pay attention to the provided invalidation level to manage risk effectively in their trading strategies.

Technical Analyst: Malik Awais

Source: Tradinglounge.com get trial here!


EURUSD-Day-Forex-Cha...

Related

Swiss Market Index Elliott Wave Technical Analysis: Covers All Essential Aspects of SMI Trading  and Looking for Bullish Trends

Swiss Market Index Elliott Wave Technical Analysis: Covers All Essential Aspects of SMI Trading and Looking for Bullish Trends

This article thoroughly analyses the Swiss Market Index (SMI) using Elliott Wave theory, offering va...

Read More >
Elliott Wave Technical analysis of PayPal Holdings Inc. (PYPL) Stock Highlighting the Current Market Structure and Movements

Elliott Wave Technical analysis of PayPal Holdings Inc. (PYPL) Stock Highlighting the Current Market Structure and Movements

This article provides a comprehensive Elliott Wave analysis of PayPal Holdings Inc. (PYPL), highligh...

Read More >
Microsoft Corp (MSFT:NASDAQ) Elliott Wave Technical Analysis 20 November 23

Microsoft Corp (MSFT:NASDAQ) Elliott Wave Technical Analysis 20 November 23

Trading Lounge Microsoft Corp.(MSFT: NASDAQ) Elliott Wave Technical Analysis on 20 November 23, MSFT...

Read More >
Wheat Commodity Elliott Wave Technical Analysis: Bearish Trend Continues

Wheat Commodity Elliott Wave Technical Analysis: Bearish Trend Continues

The Elliott Wave analysis of Wheat on February 23, 2024, reveals a corrective counter-trend movement...

Read More >
Wheat Commodity Elliott Wave Technical Analysis: Bullish Corrections and Future Price Movements in Wheat Futures

Wheat Commodity Elliott Wave Technical Analysis: Bullish Corrections and Future Price Movements in Wheat Futures

Our latest wheat price forecast for 2024 is based on Elliott Wave analysis, highlighting key market ...

Read More >
Ethereum/ U.S. dollar(ETHUSD) Elliott Wave Technical Analysis 23 November 23

Ethereum/ U.S. dollar(ETHUSD) Elliott Wave Technical Analysis 23 November 23

TradingLounge Ethereum/ U.S. dollar(ETHUSD) Elliott Wave Technical Analysis Daily and 4-Hour Chart d...

Read More >

Buy 1 Month

Get 3 Months!

Special Offer:

Trade Recommendations

Unleash the power of deversified trading with our comprehensive portfolio, covering:

  • Stock Trades
  • Crypto Trades
  • Forex Trades
  • Commodity Trades
Elliott Wave Analysis

Gain a competive edge with expert insights in to:

  • Global Indices
  • US Stocks & ASX Stocks
  • Forex & Crypto
  • Commodities
Top-Notch Trading Tools

Equip yourself with the tools of success:

  • Social Chat
  • Elliott Wave Algorithm
  • Screener
  • TradingLevels
  • Trading Game
7 Elliott Wave Analysts

Stay ahead of the market with daily charts and insightful videos
-Your secret to strategic trading!

JOIN HERE


Welcome to TradingLounge (ASIC A.R.No. 321187), specialists in trades, trading education and technical analysis, covering stocks, indices, commodities, forex and cryptocurrencies.

When you join TradingLounge you have access to everything we offer, including trade tools, educational content and a social platform to chat with like-minded investors.

Read more

@Copyright 2024 by tradinglounge.com

Contact Us

Australian no: 02 4787 6020

International no: +61 (2) 47876020

Pay with:

Find us on