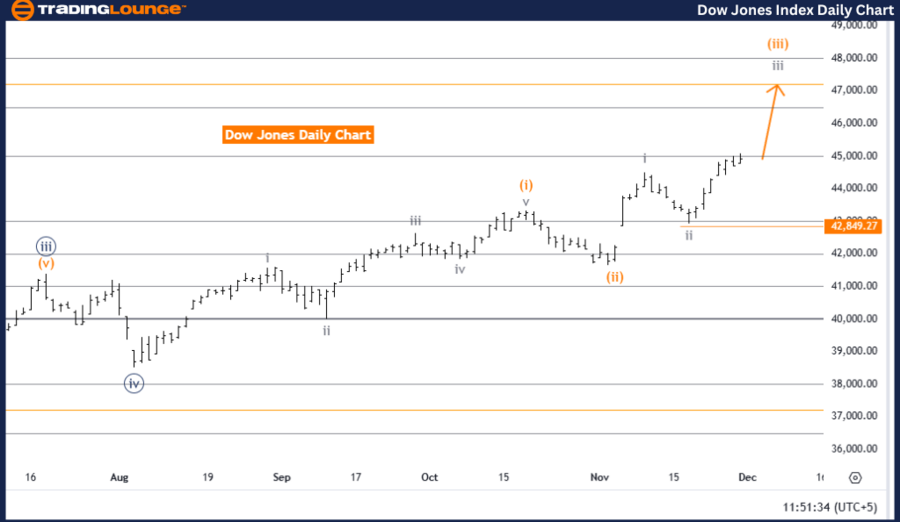
DOW JONES (DJI) Elliott Wave Analysis: Trading Lounge Daily Chart
DJI Elliott Wave Technical Analysis
Function: Bullish Trend
Mode: Impulsive
Structure: Gray Wave 3
Position: Orange Wave 3
Next Lower Degree Direction: Gray Wave 4
Details: Gray wave 2 appears complete, and gray wave 3 is currently in progress.
Wave Cancel Invalidation Level: 42,849.27
Analysis Overview
The Dow Jones Industrial Average (DJI) exhibits a bullish trend, as highlighted by Elliott Wave analysis. The market is currently in an impulsive mode, indicating strong upward momentum and an expansion phase. The active structure is gray wave 3, signaling a robust upward movement following the completion of gray wave 2.
Key Observations
Wave Structure and Position:
- The market is advancing in gray wave 3, which represents a strong bullish impulse.
- Within this wave, orange wave 3 signifies an acceleration phase, confirming the continuation of upward momentum.
Future Movements:
- Upon the completion of gray wave 3, a corrective gray wave 4 is anticipated as part of the lower-degree wave sequence.
Risk Management:
- The invalidation level for this wave count is set at 42,849.27.
- If the price falls below this threshold, the current wave count will be invalid, and the analysis will require revision.
Conclusion
Elliott Wave analysis for DJI on the daily chart suggests a sustained bullish trend, with gray wave 3 currently unfolding. The completion of gray wave 2 has led to an upward momentum phase, with further gains expected in the short term.
Key Takeaways
- Positive Market Outlook: The bullish trend is expected to persist as long as the price stays above 42,849.27.
- Next Phase: The market is likely to transition into the corrective gray wave 4 phase after gray wave 3 concludes.
This analysis underscores a favorable market outlook for DJI, offering insights for trend-following strategies and effective risk management.
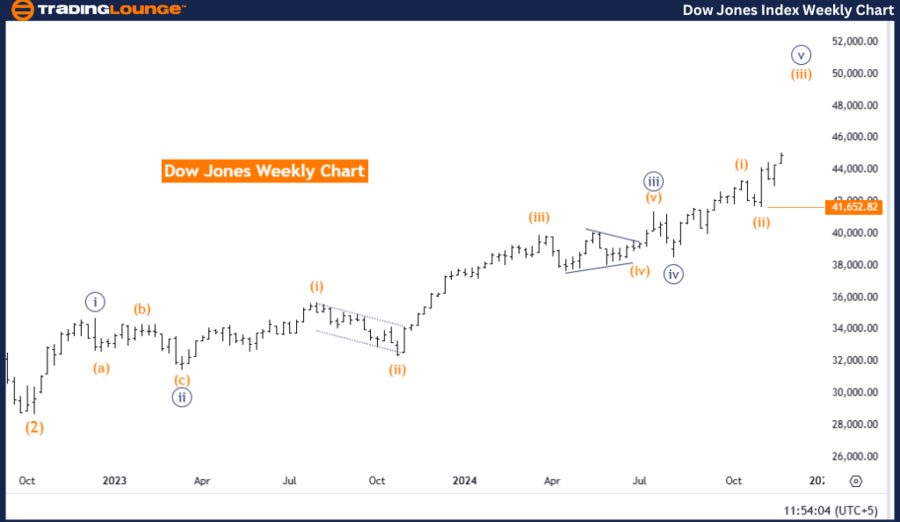
DOW JONES (DJI) Elliott Wave Analysis: Trading Lounge Weekly Chart
DJI Elliott Wave Technical Analysis
Function: Bullish Trend
Mode: Impulsive
Structure: Orange Wave 3
Position: Navy Blue Wave 5
Next Lower Degree Direction: Orange Wave 4
Details: Orange wave 2 appears complete, with orange wave 3 currently in progress.
Wave Cancel Invalidation Level: 41,652.82
Analysis Overview
On the weekly chart, the Dow Jones Industrial Average (DJI) continues to show a bullish trend based on Elliott Wave analysis. The market remains in an impulsive mode, signaling robust upward movement. The active structure is orange wave 3, which represents an expansion phase following the completion of orange wave 2.
Key Observations
Current Position and Structure:
- The market is progressing within navy blue wave 5, the final phase of a larger Elliott Wave cycle.
- Orange wave 3 highlights strong bullish momentum, suggesting additional upward movement in the short term.
Future Movements:
- After the completion of orange wave 3, the market is expected to enter a corrective orange wave 4, part of the lower-degree wave structure.
- This marks the nearing end of the larger wave cycle as navy blue wave 5 unfolds.
Risk Management:
- The invalidation level for this wave count is set at 41,652.82.
- A price drop below this threshold would invalidate the current wave count, requiring a reassessment of the analysis.
Conclusion
The weekly Elliott Wave analysis for DJI indicates a continuation of the bullish trend, with orange wave 3 actively advancing. The completion of orange wave 2 has initiated this phase of strong upward movement, supported by the impulsive nature of navy blue wave 5.
Key Takeaways
- Bullish Momentum Continues: The current upward trend is expected to persist until orange wave 3 concludes.
- Transition Ahead: A corrective orange wave 4 is anticipated following the current wave phase.
- Validation Threshold: The bullish outlook holds as long as the price remains above 41,652.82.
This analysis highlights ongoing bullish momentum while preparing for the eventual transition to a corrective phase as the larger wave structure nears its completion.
Technical Analyst: Malik Awais
Source: visit Tradinglounge.com and learn From the Experts Join TradingLounge Here
Previous: S&P/TSX 60 Elliott Wave Technical Analysis
VALUE Offer - Buy 1 Month & Get 3 Months!Click here
Access 7 Analysts Over 200 Markets Covered. Chat Room With Support