USDJPY Elliott Wave Analysis Trading Lounge, 27 February 24
U.S.Dollar/Japanese Yen (USDJPY) Day Chart Analysis
USDJPY Elliott Wave Technical Analysis
FUNCTION: Trend
MODE: Impulsive
STRUCTURE: blue wave 1
POSITION: black wave C
DIRECTION NEXT HIGHER DEGREES: blue wave 2
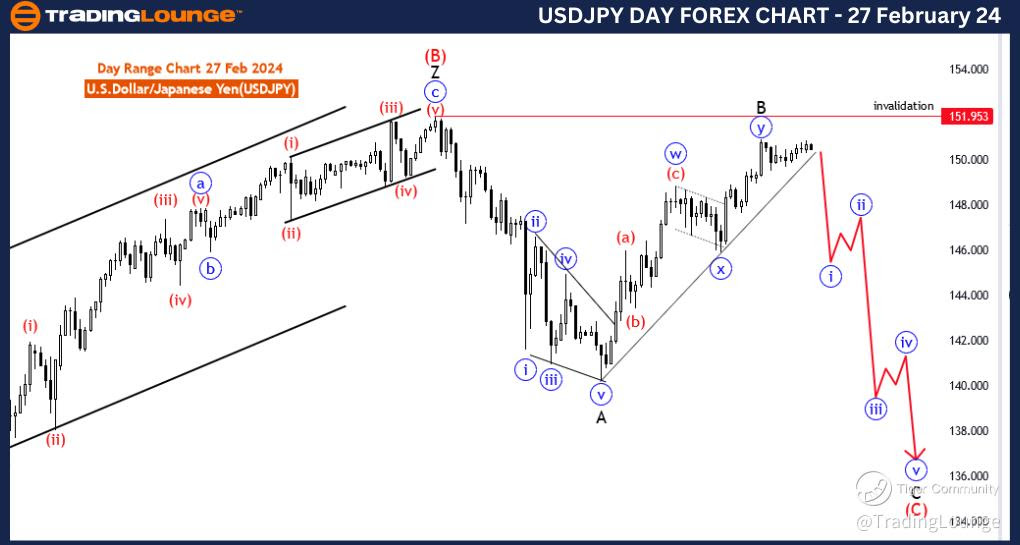
DETAILS: Blue wave Y of black wave B looking completed. now blue wave 1 of black wave C is in playWave Cancel invalid level: 151.953
The "USDJPY Elliott Wave Analysis Trading Lounge Day Chart" dated 27 February 24, provides a comprehensive analysis of the U.S. Dollar/Japanese Yen (USDJPY) currency pair using Elliott Wave principles, specifically focusing on the daily timeframe.
The identified "FUNCTION" is "Trend," indicating the primary goal of discerning and capitalizing on the prevailing market direction. This suggests a focus on capturing sustained, directional movements in the market.
The specified "MODE" is "Impulsive," suggesting that the market is currently characterized by strong, forceful, and directional price movements. This environment is conducive to identifying and participating in the primary trend.
The described "STRUCTURE" is "Blue Wave 1," denoting the specific wave within the Elliott Wave hierarchy. Blue wave 1 typically represents the initial phase of a larger impulsive move, signifying the beginning of a new trend.
The identified "POSITION" is "Black wave C," indicating the current position within the broader Elliott Wave pattern. Black wave C is often part of a corrective structure within the Elliott Wave cycle, following an impulsive move.
In terms of "DIRECTION NEXT HIGHER DEGREES," the analysis emphasizes "Blue wave 2," suggesting the anticipation of the next sub-wave within the broader Elliott Wave structure, which would follow the completion of blue wave 1.
The "DETAILS" section notes that "Blue wave Y of black wave B looking completed, and now blue wave 1 of black wave C is in play." This suggests the termination of a corrective phase (blue wave Y) and the initiation of a new impulsive move (blue wave 1).
The "Wave Cancel invalid level" is set at 151.953, serving as a critical reference point. A breach beyond this level would invalidate the current wave count and prompt a reevaluation of the analysis.
In summary, the USDJPY Elliott Wave Analysis for the daily chart on 27 February 24, indicates the commencement of a new impulsive phase (blue wave 1) within the broader corrective structure of black wave C. Traders are advised to monitor the unfolding of blue wave 1 and consider the invalidation level at 151.953.

USDJPY Elliott Wave Analysis Trading Lounge, 27 February 24
U.S.Dollar/Japanese Yen (USDJPY) 4-Hour Chart Analysis
USDJPY Elliott Wave Technical Analysis
FUNCTION: Trend
MODE: Impulsive
STRUCTURE: Red wave 3
POSITION: Blue wave 1
DIRECTION NEXT LOWER DEGREES: Red wave 3 of 1(may started)
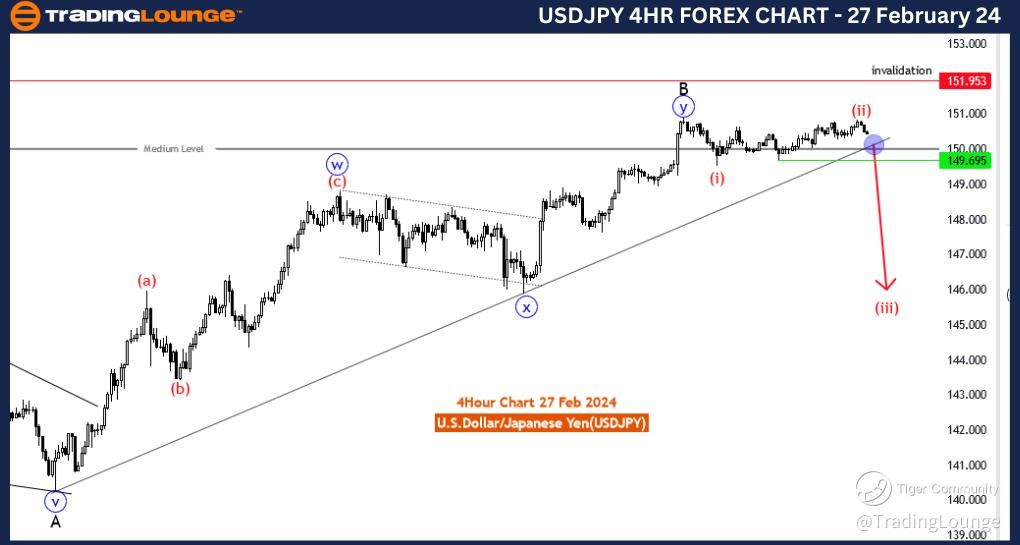
DETAILS: Red wave 2 of 1 looking completed, now looking for red wave 3 to start. Wave Cancel invalid level: 151.953
The "USDJPY Elliott Wave Analysis Trading Lounge 4 Hour Chart" dated 27 February 24, offers a detailed examination of the U.S. Dollar/Japanese Yen (USDJPY) currency pair using Elliott Wave principles, with a specific focus on the 4-hour timeframe.
The identified "FUNCTION" is "Trend," signifying the primary objective of determining and capitalizing on the prevailing market direction. This suggests a concentration on capturing sustained, directional movements in the market.
The specified "MODE" is "Impulsive," indicating a market environment characterized by strong, forceful, and directional price movements. This suggests that the current phase in the market is conducive to identifying and participating in the primary trend.
The described "STRUCTURE" is "Red wave 3," denoting the specific wave within the Elliott Wave hierarchy. Red wave 3 represents a phase of strong and extended upward movement in the context of an impulsive sequence.
The identified "POSITION" is "Blue wave 1," suggesting the current position within the broader Elliott Wave pattern. Blue wave 1 is typically the initial phase of a larger impulsive move, marking the beginning of a new trend.
In terms of "DIRECTION NEXT LOWER DEGREES," the analysis emphasizes "Red wave 3 of 1 (may have started)," indicating the anticipation of the next sub-wave within the broader Elliott Wave structure.
The "DETAILS" section notes that "Red wave 2 of 1 looking completed, now looking for red wave 3 to start." This suggests the completion of a corrective phase (red wave 2) and the expectation of the next impulsive move (red wave 3).
The "Wave Cancel invalid level" is set at 151.953, serving as a critical reference point. A breach beyond this level would invalidate the current wave count and prompt a reevaluation of the analysis.
In summary, the USDJPY Elliott Wave Analysis for the 4-hour chart on 27 February 24, indicates an expectation for the initiation of red wave 3 after the completion of a corrective phase (red wave 2). Traders are advised to monitor the unfolding of red wave 3 and consider the invalidation level at 151.953.
TradingLounge Analyst: Malik Awais
Source: visit Tradinglounge.com and learn From the Experts Join TradingLounge Here
See Previous: New Zealand Dollar/U.S.Dollar (NZDUSD)
