WTI Crude Oil Elliott wave analysis - when will the corrective rally end?

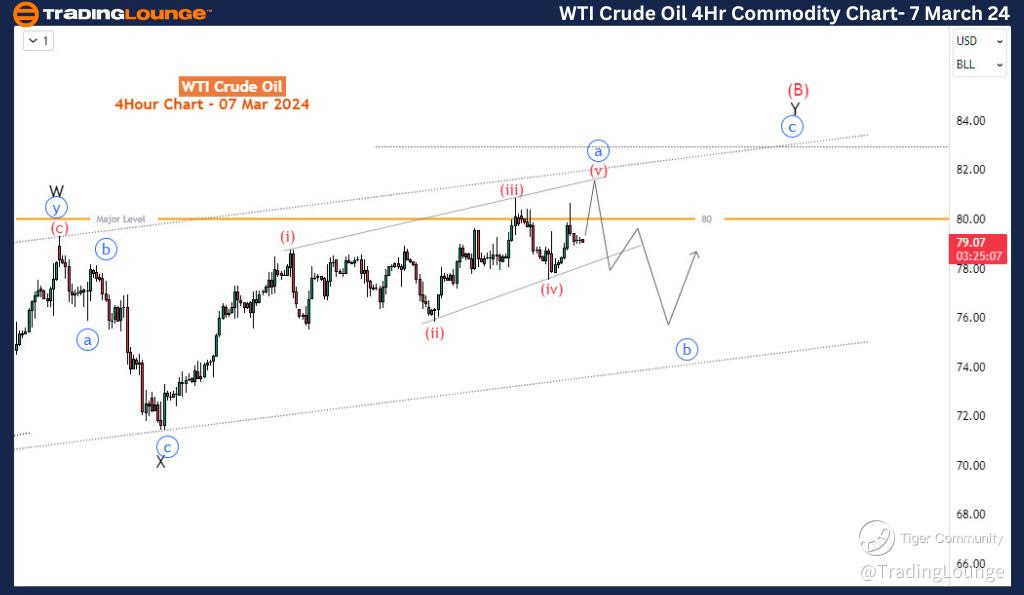
Function - Counter-trend

Mode - Corrective

Structure - Diagonal

Position - Blue wave a of Y of (B)

Direction - Blue wave b of Y of (B)

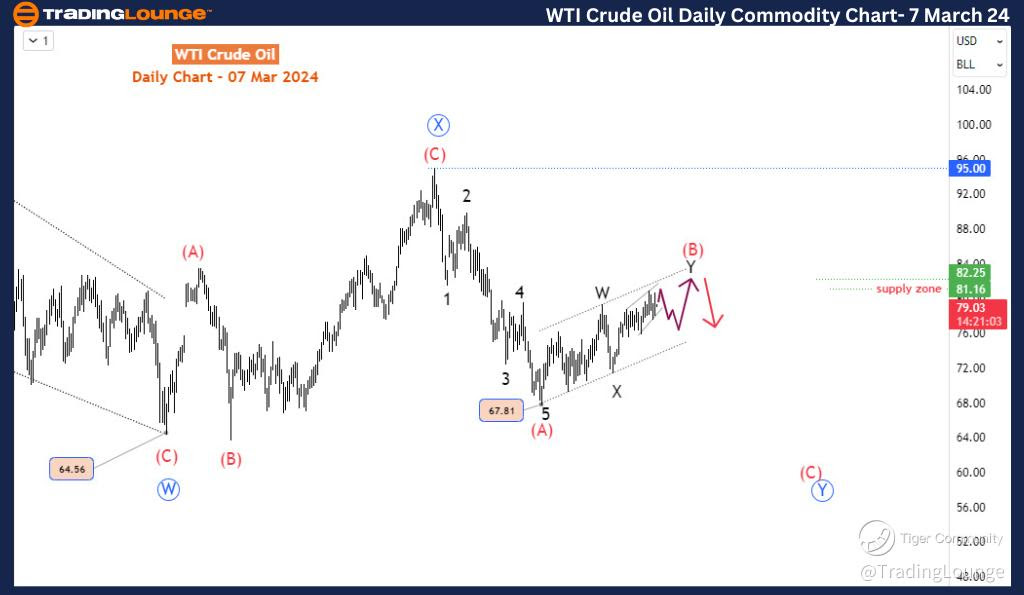
WTI Crude has witnessed a remarkable 16% surge since mid-December, yet this resurgence is indicative of a corrective phase. As traders, it's crucial to pinpoint the probable price levels where significant selling pressure might trigger a shift towards the bearish trend dominant in late 2023. Through Elliott wave analysis, we aim to dissect the nature of this corrective drive, assess its potential extent, and identify plausible termination points.

On the daily timeframe, the $95 peak reached in late September signaled the completion of a primary degree wave X, characterized by an expanding flat pattern. This milestone marked the culmination of the second leg of a double zigzag pattern within the primary degree. Subsequently, the focus shifted towards anticipating the onset of the final leg - primary degree wave Y. The price action post-$95 corroborated this projection, with wave (A) of Y materializing into a bearish impulse down to $67.81. The ensuing bullish correction has evolved into a double zigzag wave (B) of Y, poised to pave the way for wave (C) and subsequent downward movements below $60. This succinctly encapsulates a plausible medium-term Elliott wave forecast for WTI crude. However, it appears that wave (B) is yet to reach completion, necessitating further scrutiny of the evolving corrective rally on the 4-hour chart.

WTI-Crude-Oil-day-co...


WTI Crude Oil 4Hr Chart Analysis

Zooming in on the H4 chart, minor degree waves W and X of (B) have concluded their trajectories. Wave Y, envisaged as a zigzag pattern, is now unfolding. Post-wave X, price action exhibits characteristics of a diagonal pattern, aligning with the minute degree sub-wave 'a' of Y. This diagonal appears to be nearing completion, with wave (v) of a (minor degree in blue) approaching around the $80 mark, a significant psychological level. Anticipate a subsequent bearish price action post-diagonal completion, likely prompting a corrective wave b downwards, while still maintaining levels above the wave (X) low. This sets the stage for potential bullish opportunities in minute wave y of Y. Wave c of Y of (B) is anticipated to mark the denouement of wave (B), with substantial bearish momentum anticipated below $60.

Conclusion: In essence, WTI Crude finds itself amidst a medium-term corrective rally, poised to conclude within the next two legs. Prepare for a notable sell-off post-completion, as the market dynamics shift towards a bearish trajectory. Stay informed, stay vigilant, and capitalize on the insights gleaned from Elliott wave analysis to navigate the fluctuations of the WTI Crude market with precision and confidence.

Technical Analyst: Sanmi Adeagbo

Source: visit Tradinglounge.com and learn From the Experts Join TradingLounge Here 

See Previous: Wheat Commodity

TradingLounge Once Off SPECIAL DEAL: Here > 1 month Get 3 months.   

WTI-Crude-Oil-4Hr-co...

Related

Eli Lilly & Co.(ELI:NYSE) Elliott Wave Technical Analysis 24 January 24

Eli Lilly & Co.(ELI:NYSE) Elliott Wave Technical Analysis 24 January 24

Eli Lilly & Co.(LLY: NYSE) Elliott Wave Technical Analysis dated 24 January 24, ELI Stock Market Ana...

Read More >
Stay ahead of the Market with Our Expert XRP Chart Analysis and Price Predictions: XRPUSD Elliott Wave Technical Analysis

Stay ahead of the Market with Our Expert XRP Chart Analysis and Price Predictions: XRPUSD Elliott Wave Technical Analysis

Gain insights into XRP price movements with our in-depth Elliott Wave analysis. Discover trading str...

Read More >
Maruti Suzuki India Stock Prediction: In-Depth Elliott Wave Technical  Analysis and Market Trends

Maruti Suzuki India Stock Prediction: In-Depth Elliott Wave Technical Analysis and Market Trends

This article provides a detailed Elliott Wave analysis of Maruti Suzuki stock. It covers key technic...

Read More >
ASX Commonwealth Bank of Australia (CBA) Stock Movements with Short-term and Long-term Insights: Elliott Wave Analysis

ASX Commonwealth Bank of Australia (CBA) Stock Movements with Short-term and Long-term Insights: Elliott Wave Analysis

This detailed analysis of Commonwealth Bank of Australia (CBA) focuses on Elliott Wave theory to pro...

Read More >
Soybean Commodity Market's Elliott Wave Structure: Examining the Ongoing Bearish Trend and Forecasting Future Movements

Soybean Commodity Market's Elliott Wave Structure: Examining the Ongoing Bearish Trend and Forecasting Future Movements

This analysis dives into the soybean market's Elliott Wave structure, examining the ongoing bear...

Read More >
British Pound/Australian Dollar (GBPAUD) Forex Elliott Wave Technical Analysis: Bearish Trend with Wave 3 Driving Further Declines

British Pound/Australian Dollar (GBPAUD) Forex Elliott Wave Technical Analysis: Bearish Trend with Wave 3 Driving Further Declines

The GBPAUD analysis on both daily and 4-hour charts shows a strong bearish trend, with navy blue wav...

Read More >

Buy 1 Month

Get 3 Months!

Special Offer:

Trade Recommendations

Unleash the power of deversified trading with our comprehensive portfolio, covering:

  • Stock Trades
  • Crypto Trades
  • Forex Trades
  • Commodity Trades
Elliott Wave Analysis

Gain a competive edge with expert insights in to:

  • Global Indices
  • US Stocks & ASX Stocks
  • Forex & Crypto
  • Commodities
Top-Notch Trading Tools

Equip yourself with the tools of success:

  • Social Chat
  • Elliott Wave Algorithm
  • Screener
  • TradingLevels
  • Trading Game
7 Elliott Wave Analysts

Stay ahead of the market with daily charts and insightful videos
-Your secret to strategic trading!

JOIN HERE


Welcome to TradingLounge (ASIC A.R.No. 321187), specialists in trades, trading education and technical analysis, covering stocks, indices, commodities, forex and cryptocurrencies.

When you join TradingLounge you have access to everything we offer, including trade tools, educational content and a social platform to chat with like-minded investors.

Read more

@Copyright 2024 by tradinglounge.com

Contact Us

Australian no: 02 4787 6020

International no: +61 (2) 47876020

Pay with:

Find us on