SMCI Elliott Wave Analysis: Comprehensive Review for Super Micro Computer Inc.
On April 19, 2024, our Elliott Wave analysis of Super Micro Computer Inc. (Ticker: SMCI) focuses on the latest stock patterns captured on both daily and 4-hour charts. This analysis aims to provide investors with precise insights into potential future movements and price stabilization points.
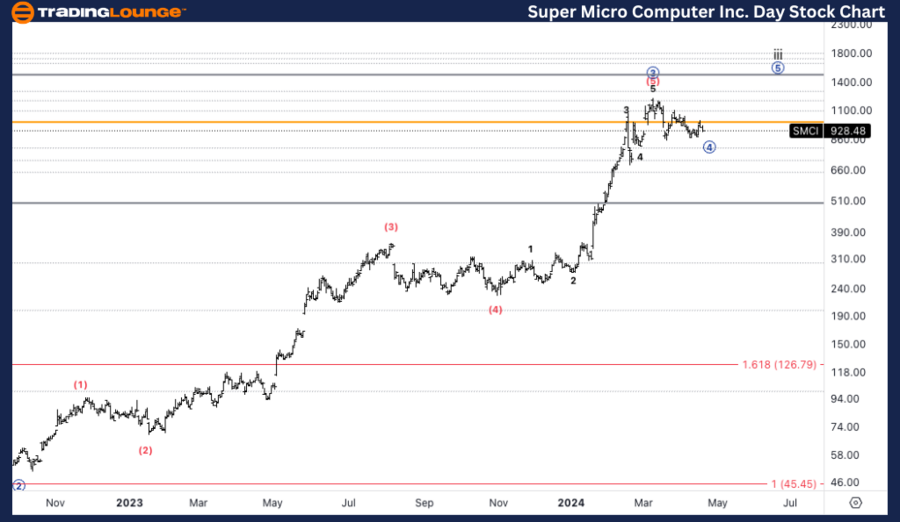
Super Micro Computer Inc. (SMCI) Daily Chart Overview
SMCI Elliott Wave Technical Analysis
Elliott Wave Technical Analysis Summary
- Function: Counter Trend
- Mode: Corrective
- Structure: Flat
- Position: Micro wave 4
- Direction: Anticipated completion of a triangle in Micro wave 4
- Key Details: Analysts expect a correction in SMCI's stock price, targeting around $1000. This marks the potential completion of the triangle in wave 4. Should this pattern not materialize, the stock might enter a sideways trend, identified as wave B of 4, before possibly declining towards the $800 mark.
Deeper Insight into SMCI’s Elliott Wave Analysis on the Daily Chart
Elliott Wave Analysis serves as a dynamic tool in technical stock analysis, providing insights based on wave patterns which predict future price actions by interpreting investor psychology and market sentiment. For Super Micro Computer Inc. (SMCI), the current analysis highlights a critical juncture in its daily trading chart. As we delve into Micro Wave 4, the expected completion of a corrective triangle pattern suggests a pivotal moment for investors.
This corrective phase is categorized as a "Flat" structure, indicating a consolidation period that might either resolve upwards to the $1000 level or break down towards $800, dependent on investor reactions and market dynamics. Such patterns are crucial for traders focusing on counter-trend strategies, where identifying completion points of corrective waves allows for strategic positioning ahead of potential market moves.
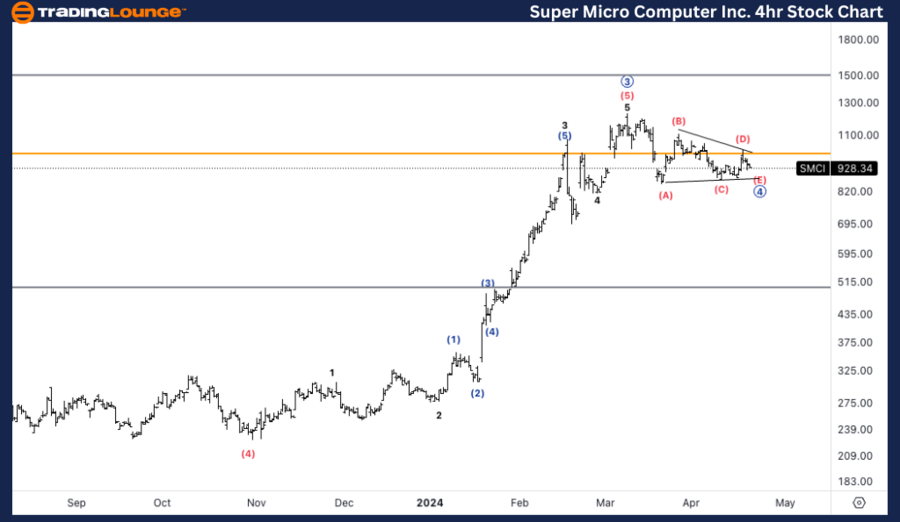
SMCI Elliott Wave Technical Examination on the 4Hr Chart
SMCI Elliott Wave Technical Details
- Function: Counter Trend
- Mode: Corrective
- Structure: Flat
- Position: Wave (v) of {c}
- Direction: Targeting the end of the consolidation in micro wave 4
- Insightful Details: The analysis further explores the intricacies of the triangular formation. The stock might maintain its sideways movement as the market anticipates the upcoming earnings report on April 30th.
In-Depth Analysis of SMCI 4-Hour Trading Chart
Transitioning to the 4-hour chart of SMCI, the ongoing analysis refines our understanding of the stock’s behaviour within shorter intervals. Positioned in wave (v) of {c}, the stock is at a crucial phase within its corrective pattern, with an ongoing triangular consolidation being the focal point.
This detail is particularly significant as it coincides with the nearing earnings report, an event that could catalyze the next major price movement. Whether the outcome of this report supports a bullish recovery back to the $1000 level or triggers a bearish decline toward $800 remains contingent on the financial results and market perception.
Conclusion and Strategic Considerations
For investors and traders employing Elliott Wave Analysis in their strategy, understanding the nuanced movements within SMCI's price charts is essential. Both the daily and 4-hour charts suggest a period of consolidation and correction, offering potential opportunities for strategic entries and exits based on the completion of the anticipated patterns.
Technical Analyst: Alessio Barretta
Source: visit Tradinglounge.com and learn From the Experts Join TradingLounge Here
See Previous: The Coca-Cola Company (KO)
TradingLounge Once Off SPECIAL DEAL: Here > 1 month Get 3 months.
TradingLounge's Free Week Extravaganza!
April 14 – 21: Unlock the Doors to Trading Excellence — Absolutely FREE