Elliott Wave Analysis of Dogecoin/U.S. Dollar (DOGEUSD) - Daily Chart Overview
In the rapidly evolving world of cryptocurrency trading, Elliott Wave analysis provides insightful tools for predicting price movements. Today, we delve into the daily and H4 chart analysis of Dogecoin against the U.S. dollar (DOGEUSD), highlighting the technical structures and trading strategies that could guide traders in navigating this market.
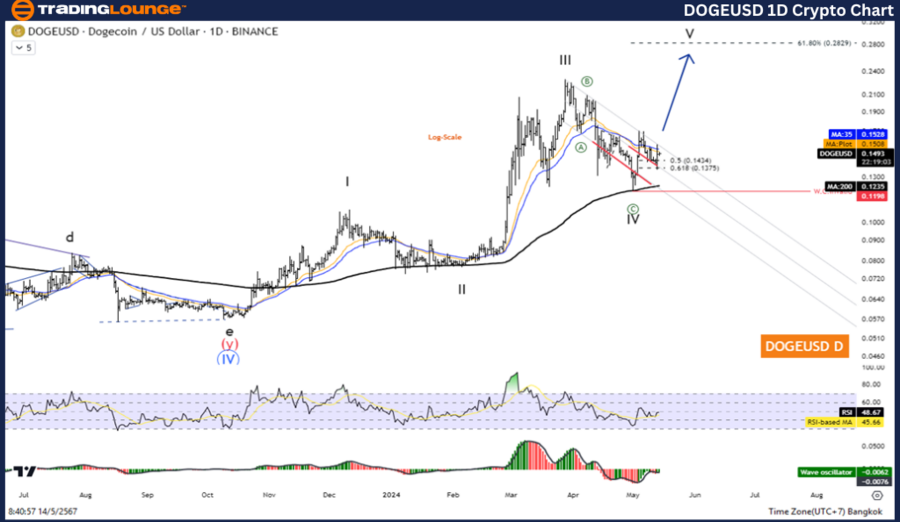
DOGEUSD Elliott Wave Technical Analysis
Elliott Wave Analysis: Understanding the Current Market Structure
Function: Counter Trend
Mode: Corrective
Structure: Zigzag
Position: Wave ((C))
Direction Next higher Degrees: Wave IV of Impulse
Wave Cancel invalid Level:
Details: Wave IV May is complete and the price increase again in Wave V
Detailed Analysis and Predictions
The analysis of DOGEUSD reveals that we are presently in the corrective phase of a counter-trend, specifically within a zigzag structure. This structure suggests a temporary divergence from the primary uptrend, typically seen as an adjustment before a major price movement.
As we identify Wave ((C)) in the current structure, it is anticipated that the completion of this wave will pave the way for an upward trajectory in Wave IV of the impulse sequence. Traders should be vigilant, as a conclusive end to Wave ((C)) indicates potential for significant bullish momentum.
Dogecoin/U.S. Dollar Trading Strategy
With Dogecoin maintaining its overall uptrend, the completion of the corrective phase seems imminent. The transition into Wave V suggests an impending price increase. However, traders might encounter a minor pullback before the ascent resumes. This pullback represents a strategic entry point for investors looking to capitalize on the forthcoming upward movement.
Technical Indicators and Market Sentiment
The optimistic outlook is further supported by key technical indicators:
- The price of Dogecoin is currently positioned above the 200-day moving average (MA200), a strong indicator of an underlying uptrend.
- The Wave Oscillator, a tool specifically designed to gauge momentum within the context of Elliott Wave analysis, shows bullish momentum, reinforcing the positive sentiment in the market.
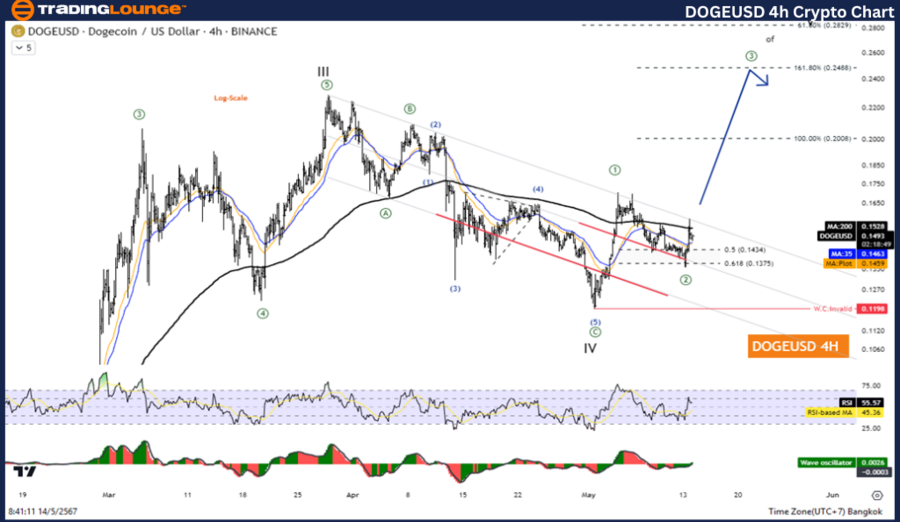
DOGEUSD Elliott Wave Analysis: H4 Chart Specifics
Reaffirming the insights from the daily chart, the H4 chart for DOGEUSD mirrors the technical patterns and predictions:
Function: Counter Trend
Mode: Corrective
Structure: Zigzag
Position: Wave ((C))
Direction Next higher Degrees: Wave IV of Impulse
Wave Cancel invalid Level:
Details: Wave IV May is complete and the price increase again in Wave V
H4 Chart Analysis and Trading Insights
This shorter time frame chart confirms the corrective zigzag pattern noted in the daily analysis. It offers a closer look at the price dynamics and helps traders fine-tune their entry and exit strategies based on shorter-term movements and corrections.
Key Takeaways and Trading Tips
As Dogecoin approaches the completion of its corrective phase in Wave ((C)), traders should prepare for the initiation of Wave V. This wave is expected to propel prices higher, following the brief pullback. Here are strategic insights for trading DOGEUSD using Elliott Wave analysis:
- Monitor the MA200: Maintaining positions above this key level suggests strong market support for Dogecoin.
- Observe Wave Oscillator Trends: Look for continued bullish signals to confirm your trading stance.
- Prepare for Short-Term Pullbacks: Use these as opportunities to enhance your position before the next upward wave.
Technical Analyst: Kittiampon Somboonsod
Source: visit Tradinglounge.com and learn From the Experts Join TradingLounge Here
See Previous: Bitcoin Crypto Price News Today Bitcoin/U.S. Dollar (BTCUSD)
Special Trial Offer - 0.76 Cents a Day for 3 Months! Click here
Access 7 Analysts Over 170 Markets Covered. Chat Room With Support
Conclusion
Elliott Wave analysis presents a compelling framework for understanding the price dynamics of Dogecoin against the U.S. dollar. By aligning trading strategies with the identified wave patterns and technical indicators, traders can more effectively anticipate and react to market movements, maximizing their potential for profitability in the volatile cryptocurrency market.