Soybeans Elliott Wave Analysis: An Overview of Current Trends and Predictions

Function: Trend 

Mode: Impulse

Structure: Impulse for (5)

Position: Wave 2 of (5)

Direction: Wave 3 of (5)

Details: Wave 2 of (5) appears to be concluding, with the market now entering Wave 3. A drop below 1144 would validate this, provided prices don’t rally above 1226. The situation remains largely unchanged since the previous update.

Introduction to Current Market Dynamics

April has brought a dynamic shift in the soybean market, revealing a complex pattern of price movements. Initially, the month showed a reversal of the gains made earlier, leading to a decline in the latter half. This reversal is part of a larger trend where, after a recovery in March, soybean prices have started to give up their earlier advances. The commodity is now at a critical juncture, looking to break through significant support levels, potentially continuing the bearish trend that started in June 2022.

In-depth Daily Chart Analysis

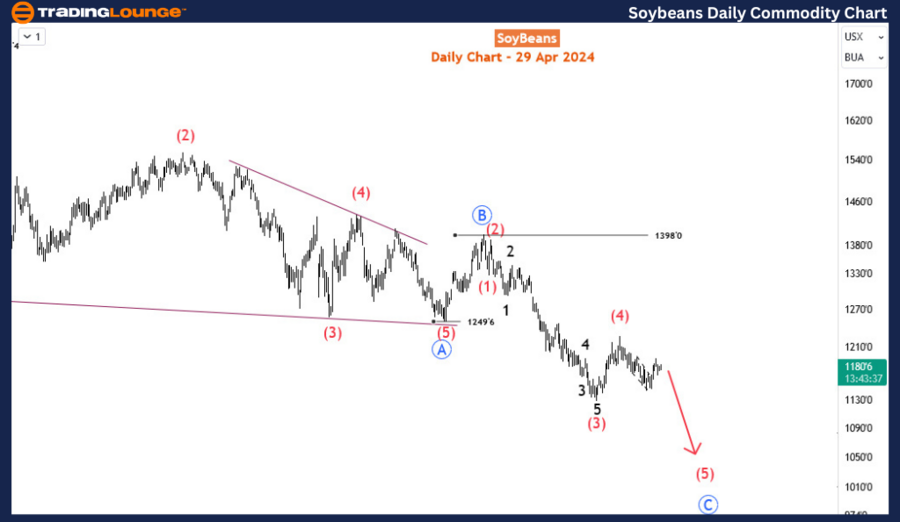
The daily chart of soybean prices since June 2022 illustrates a strong bearish trend, starting from a high of $1785. Over this period, the market has dropped by more than 34%, marking a significant downturn. This decline is part of a correction phase within a broader bullish impulse that lasted from May 2019 to June 2022. While this correction tempers immediate bullish sentiment, it may set the stage for a future bullish resurgence once this corrective period concludes. However, the future direction remains uncertain, with the possibility of further declines in the coming weeks. Elliott wave theory suggests this pattern is a zigzag correction, marked by waves A-B-C of the primary degree, with the current decline being wave (5) of blue wave C.

Soybeans-1D-Commodit...


Detailed H4 Chart Perspective

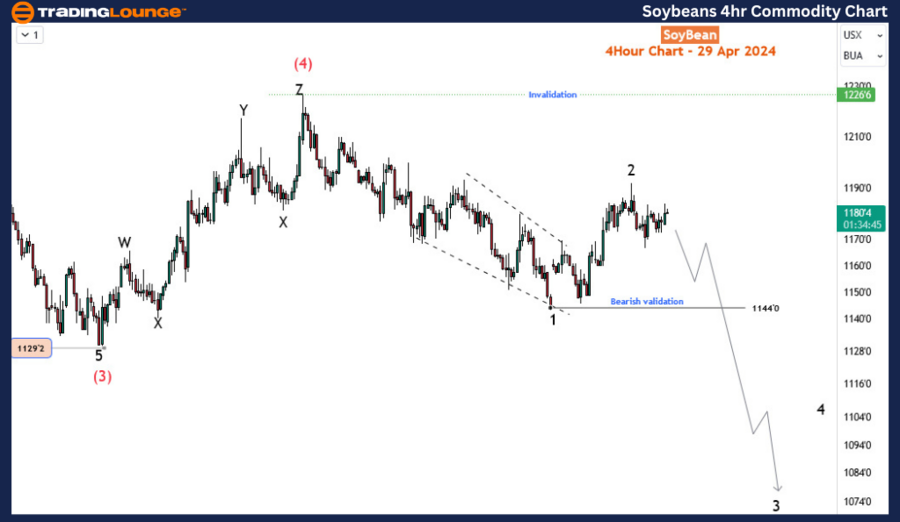
Zooming into the H4 chart provides a closer look at recent price actions. Here, wave (4) concluded at 1226, leading into the start of wave (5). The first wave of (5) formed a diagonal pattern ending at 1140 in April 2024, followed by a corrective rebound currently identified as wave 2. The end of Wave 2 and the beginning of Wave 3 will be confirmed if prices fall below the 1140 mark. However, if the current rally surpasses the peak of wave (4) at 1226, it could invalidate the existing wave forecast. As the soybean market continues to navigate these fluctuations, Elliott wave analysis provides valuable insights into its potential paths.

Technical Analyst: Sanmi Adeagbo

Source: visit Tradinglounge.com and learn From the Experts Join TradingLounge Here 

See Previous: In-Depth Elliott Wave Analysis of WTI Crude Oil's

Special Trial Offer - 0.76 Cents a Day for 3 Months! Click here

Access 6 Analysts covering over 150 Markets. Chat Room With Support

Soybeans-4Hr-Commodi...

Conclusion and Future Outlook

As we analyze soybean prices through the Elliott wave framework, it’s clear that understanding these patterns can offer predictive insights into market trends. The ongoing corrective wave could lead to further declines or set up a resurgence in bullish momentum, depending on how it evolves. Investors and analysts should keep a close watch on key price levels to gauge the market's next movements.

Related

BTCUSD Elliott Wave Analysis, Focusing on Bitcoin's Price Trends and Potential Market Movements Next Possible Uptrend

BTCUSD Elliott Wave Analysis, Focusing on Bitcoin's Price Trends and Potential Market Movements Next Possible Uptrend

This article provides a comprehensive BTCUSD Elliott Wave analysis, focusing on Bitcoin's price ...

Read More >
Bull Market Elliott Wave Trading Strategies SP500, NASDAQ, DAX 40, FTSE 100, ASX 200 - Trading Lounge

Bull Market Elliott Wave Trading Strategies SP500, NASDAQ, DAX 40, FTSE 100, ASX 200 - Trading Lounge

Elliott Wave analysis highlights a bullish structure in the S&P 500, strength in banks, and a weaker...

Read More >
Effective Trading Strategies: Chainlink Crypto Price News Today Elliott Wave Technical Analysis

Effective Trading Strategies: Chainlink Crypto Price News Today Elliott Wave Technical Analysis

This article provides an in-depth Elliott Wave Analysis for ChainLink (LINKUSD), offering insights i...

Read More >
Unlocking ASX Trading Success: BLOCK INC. - SQ2 Stock Analysis & Elliott Wave Technical Forecast

Unlocking ASX Trading Success: BLOCK INC. - SQ2 Stock Analysis & Elliott Wave Technical Forecast

Our comprehensive analysis provides an insightful look into Block Inc. - SQ2 using Elliott Wave theo...

Read More >
Latest Elliott Wave technical Analysis for Fisher & Paykel Healthcare (FPH) stock on the ASX Market: Learn How FPH Could Move

Latest Elliott Wave technical Analysis for Fisher & Paykel Healthcare (FPH) stock on the ASX Market: Learn How FPH Could Move

Discover the latest Elliott Wave technical analysis for Fisher & Paykel Healthcare (FPH) stock on th...

Read More >
Bitcoin/ U.S. dollar(BTCUSD) Elliott Wave Technical Analysis 5 December 23

Bitcoin/ U.S. dollar(BTCUSD) Elliott Wave Technical Analysis 5 December 23

Bitcoin/U.S. dollar(BTCUSD) Elliott Wave Technical Analysis dated 5 December 23 with BTCUSD Analysis...

Read More >

Buy 1 Month

Get 3 Months!

Special Offer:

Trade Recommendations

Unleash the power of deversified trading with our comprehensive portfolio, covering:

  • Stock Trades
  • Crypto Trades
  • Forex Trades
  • Commodity Trades
Elliott Wave Analysis

Gain a competive edge with expert insights in to:

  • Global Indices
  • US Stocks & ASX Stocks
  • Forex & Crypto
  • Commodities
Top-Notch Trading Tools

Equip yourself with the tools of success:

  • Social Chat
  • Elliott Wave Algorithm
  • Screener
  • TradingLevels
  • Trading Game
7 Elliott Wave Analysts

Stay ahead of the market with daily charts and insightful videos
-Your secret to strategic trading!

JOIN HERE


Welcome to TradingLounge (ASIC A.R.No. 321187), specialists in trades, trading education and technical analysis, covering stocks, indices, commodities, forex and cryptocurrencies.

When you join TradingLounge you have access to everything we offer, including trade tools, educational content and a social platform to chat with like-minded investors.

Read more

@Copyright 2024 by tradinglounge.com

Contact Us

Australian no: 02 4787 6020

International no: +61 (2) 47876020

Pay with:

Find us on