Elliott Wave Analysis TradingLounge Daily Chart, - Bitcoin/USD (BTCUSD)

BTCUSD Elliott Wave Technical Analysis

  • Function: Counter Trend

  • Mode: Corrective

  • Structure: Flat

  • Position: Wave ((C))

  • Next Higher Degrees: Wave (III)

  • Invalidation Level: 31,046.25

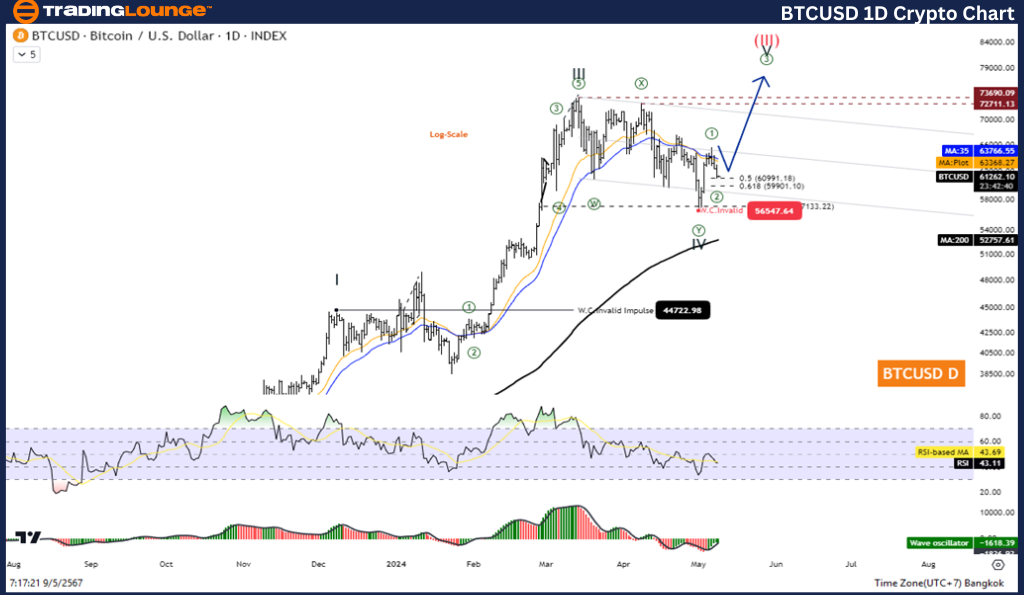
Detailed Insights: The current analysis suggests that Wave IV may have concluded, setting the stage for a potential uptick in price during Wave V. This development indicates a pivotal phase where BTCUSD could regain momentum.

Bitcoin/USD (BTCUSD) Trading Strategy: Bitcoin remains on a general uptrend despite undergoing a correction in its fourth wave. With indications that this corrective phase might be over, there exists a renewed opportunity to engage with the market by initiating long positions.

Bitcoin/USD (BTCUSD) Technical Indicators: Key indicators support a bullish outlook:

  • The price remains above the 200-day Moving Average (MA200), signalling a continued uptrend.
  • The Wave Oscillator shows bullish momentum, further confirming the positive trend.

BTCUSD-1D-Crypto-cha...


Elliott Wave Analysis TradingLounge H4 Chart - Bitcoin/USD (BTCUSD)

BTCUSD Elliott Wave Technical Analysis

  • Function: Counter Trend

  • Mode: Corrective

  • Structure: Flat

  • Position: Wave C

  • Next Higher Degrees: Wave (2)

  • Invalidation Level: 59,835.83

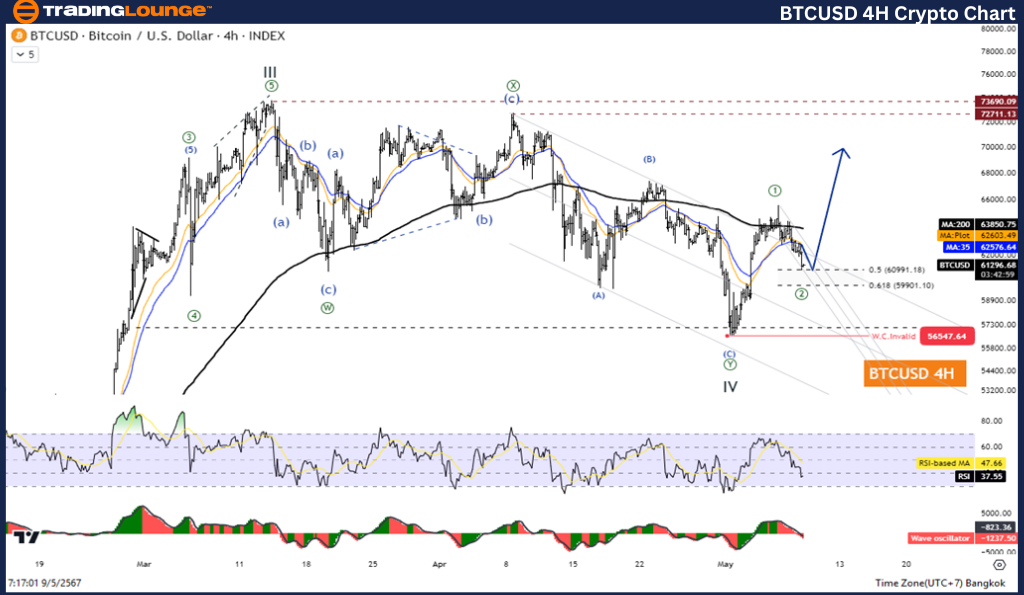
Detailed Insights: The analysis of the H4 chart reveals that Wave (2) matches 61.8% of Wave (1) at 61,903.07, suggesting a precise and typical retracement within the Elliott Wave framework. This reinforces the likelihood of a bullish continuation pattern.

Bitcoin/USD (BTCUSD) Trading Strategy: The consistency in the trading strategy across different time frames underscores the strength of the current uptrend. With the correction phase appearing complete, traders should consider strategies that capitalize on the expected upward movement.

Bitcoin/USD (BTCUSD) Technical Indicators:

  • The sustained position above the MA200 enhances confidence in a bullish scenario.
  • The positive readings from the Wave Oscillator complement the technical forecast, advocating for long positions in BTCUSD.

Technical Analyst: Kittiampon Somboonsod

Source: visit Tradinglounge.com and learn From the Experts Join TradingLounge Here 

Previous: NEO/ U.S. dollar(NEOUSD) Technical Analysis

Bitcoin Prediction Guess the Price?   Test Your Analysis - Win 1 Million Satoshi

Special Trial Offer - 0.76 Cents a Day for 3 Months! Click here

Access 7 Analysts Over 170 Markets Covered. Chat Room With Support

BTCUSD-4hr-Crypto-ch...

Conclusion: The Elliott Wave analysis for BTCUSD on both daily and H4 charts presents a compelling case for an upcoming positive phase in Bitcoin’s price trajectory. Traders should monitor these levels closely, as a breach beyond the invalidation points could necessitate a reassessment of the current market strategy. This detailed analysis not only aids traders in aligning with the prevailing market conditions but also enhances their understanding of potential future movements in the Bitcoin market.

Related

Ripple Xrp Crypto Price News Today Elliott Wave Technical Analysis: Ripple XRP's Forecast and Price Movements

Ripple Xrp Crypto Price News Today Elliott Wave Technical Analysis: Ripple XRP's Forecast and Price Movements

This comprehensive guide covers XRP price prediction, technical analysis, and Elliott Wave insights....

Read More >
We covers it all Bovespa Index Trading, Combining Elliott Wave Technical Analysis with up-to-date Bovespa Market Trends

We covers it all Bovespa Index Trading, Combining Elliott Wave Technical Analysis with up-to-date Bovespa Market Trends

This guide provides an in-depth look at Bovespa Index trading, combining Elliott Wave analysis with ...

Read More >
Euro/U.S.Dollar(EURUSD) Day Chart Elliott Wave Technical Analysis 10 November 23

Euro/U.S.Dollar(EURUSD) Day Chart Elliott Wave Technical Analysis 10 November 23

Euro/U.S.Dollar(EURUSD) Day Chart Elliott Wave Technical Analysis 10 November 23 suggests a Counter ...

Read More >
Explore Hang Seng ETFs, Index Funds, and more to Enhance your Trading Portfolio: Hang Seng Index Elliott Wave Technical Analysis

Explore Hang Seng ETFs, Index Funds, and more to Enhance your Trading Portfolio: Hang Seng Index Elliott Wave Technical Analysis

Unlock the potential of Hang Seng trading with our in-depth guide. From Elliott Wave analysis and HS...

Read More >
Elliott Wave Analysis and Trading Strategies for NASDAQ Tech Stocks

Elliott Wave Analysis and Trading Strategies for NASDAQ Tech Stocks

The summary of the Elliott Wave analysis for NASDAQ tech stocks indicates that there might be a pote...

Read More >

Buy 1 Month

Get 3 Months!

Special Offer:

Trade Recommendations

Unleash the power of deversified trading with our comprehensive portfolio, covering:

  • Stock Trades
  • Crypto Trades
  • Forex Trades
  • Commodity Trades
Elliott Wave Analysis

Gain a competive edge with expert insights in to:

  • Global Indices
  • US Stocks & ASX Stocks
  • Forex & Crypto
  • Commodities
Top-Notch Trading Tools

Equip yourself with the tools of success:

  • Social Chat
  • Elliott Wave Algorithm
  • Screener
  • TradingLevels
  • Trading Game
7 Elliott Wave Analysts

Stay ahead of the market with daily charts and insightful videos
-Your secret to strategic trading!

JOIN HERE


Welcome to TradingLounge (ASIC A.R.No. 321187), specialists in trades, trading education and technical analysis, covering stocks, indices, commodities, forex and cryptocurrencies.

When you join TradingLounge you have access to everything we offer, including trade tools, educational content and a social platform to chat with like-minded investors.

Read more

@Copyright 2024 by tradinglounge.com

Contact Us

Australian no: 02 4787 6020

International no: +61 (2) 47876020

Pay with:

Find us on