TradingLounge Commodity Trading using Gold Elliott Wave Analysis

Gold Elliott Wave Technical Analysis

Gold has experienced a remarkable ascent, surging by over 22% in 2024 so far. The precious metal is nearing another peak within just over a week, highlighting strong momentum in its ongoing rally. Technically, the price action indicates that Gold is poised for a significant breakout after a week of range-bound movement. This potential breakout could propel Gold to new heights, reinforcing its bullish outlook.

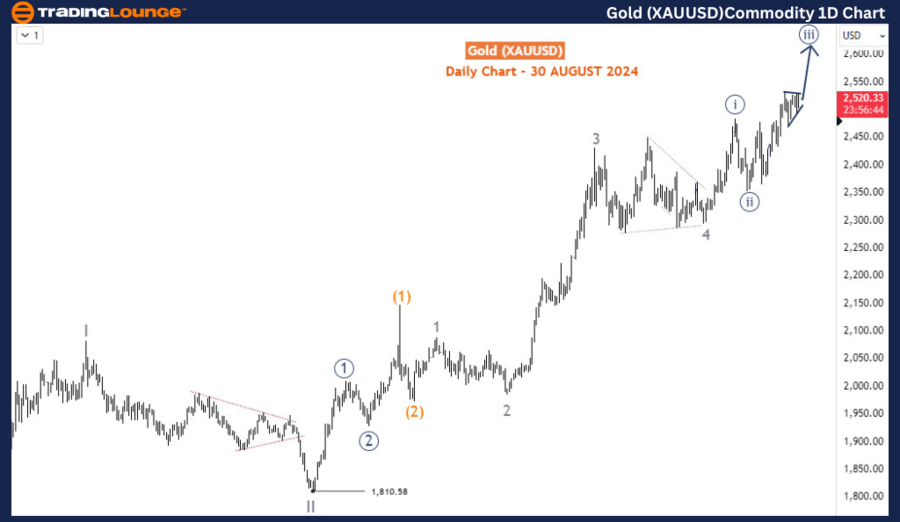
Gold (XAUUSD) Daily Chart Analysis

On the daily chart, Gold has recently completed the supercycle wave (IV), marking a corrective phase in the long-term bullish trend that began in December 2015. The completion of wave (IV) has paved the way for the emergence of a new impulse wave, labeled wave (V). This wave (V) is part of a larger Elliott Wave structure, anticipated to carry Gold to significantly higher levels.

Within wave (V), the first two sub-waves, I and II, were completed in May and October 2023, respectively. Currently, Gold is progressing through wave (3) of III (circled), a crucial segment in the overall wave structure. Wave (3) of III is typically the most powerful and extended wave in an Elliott Wave sequence, and the current move aligns with this pattern. The ongoing wave (3) of III has the potential to push Gold beyond the 2600 level before concluding.

The consolidation phase observed between April 12th and June 26th corresponds with wave 4 of (3), a corrective phase that allowed the market to absorb previous gains. Now, Gold is in wave 5 of (3), which is expected to drive the price past previous highs and establish new records, further solidifying the strong bullish sentiment dominating the market.
Gold-XAUUSD-Commodit...


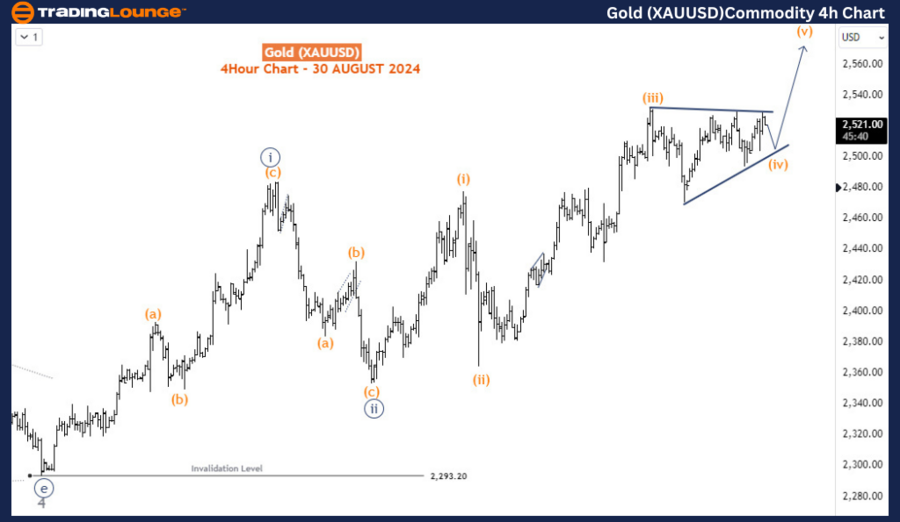
Gold (XAUUSD) 4-Hour Chart Analysis

Zooming into the H4 chart, Gold is currently in wave iii (circled) of 5, within the broader wave (3) of III. The price has been trading within a one-week triangle range, identified as wave (iv) of iii (circled). This pattern is a classic Elliott Wave setup, often leading to a strong breakout. A decisive upside break is anticipated, leading to the completion of wave (v) of iii (circled), with near-term targets in the 2550-2600 range. This breakout would mark another significant milestone in Gold's ongoing rally as it continues to ascend towards new heights. The overall bullish outlook remains robust, underpinned by strong technical factors.

Technical Analyst: Sanmi Adeagbo

Source: visit Tradinglounge.com and learn From the Experts Join TradingLounge Here 

See Previous: Wheat Elliott Wave Technical Analysis

Special Trial Offer - 0.76 Cents a Day for 3 Months! Click here

Access 7 Analysts Over 200 Markets Covered. Chat Room With Support

Gold-XAUUSD-Commodit...

Related

Bitcoin/ U.S. dollar(BTCUSD) Elliott Wave Technical Analysis 11 December 23

Bitcoin/ U.S. dollar(BTCUSD) Elliott Wave Technical Analysis 11 December 23

Bitcoin/U.S. dollar(BTCUSD) Elliott Wave Technical Analysis dated 11 December 23 with Bitcoin and U....

Read More >
Larsen & Toubro Stocks Elliott Wave Technical Analysis: Understand LT Share Price targets and Market Sorecasts

Larsen & Toubro Stocks Elliott Wave Technical Analysis: Understand LT Share Price targets and Market Sorecasts

This article provides an in-depth Elliott Wave analysis for Larsen & Toubro (LT), covering daily and...

Read More >
Identify potential opportunities and key support for Deere & Co. Stock: DE Stocks Elliott Wave Technical Analysis

Identify potential opportunities and key support for Deere & Co. Stock: DE Stocks Elliott Wave Technical Analysis

This comprehensive Elliott Wave analysis for Deere & Co. (DE) provides a detailed examination of DE&...

Read More >
Maximize Your Returns: In-Depth Apple (AAPL) Stock Analysis & 2024 Elliott Wave Forecast

Maximize Your Returns: In-Depth Apple (AAPL) Stock Analysis & 2024 Elliott Wave Forecast

Stay ahead in your trading game with our comprehensive Elliott Wave analysis of Apple Inc. (AAPL). T...

Read More >
Netflix (NFLX) Set for Major Rally: NFLX Stocks Elliott Wave Technical Analysis Reveals $800 Price Target

Netflix (NFLX) Set for Major Rally: NFLX Stocks Elliott Wave Technical Analysis Reveals $800 Price Target

This article provides a detailed Elliott Wave analysis of Netflix Inc. (NFLX), offering insights int...

Read More >
Discover How Newmont Corporation is Expected to Perform in the Upcoming Market Sessions: NEM Elliott Wave Analysis

Discover How Newmont Corporation is Expected to Perform in the Upcoming Market Sessions: NEM Elliott Wave Analysis

Our detailed Elliott Wave analysis of ASX Newmont Corporation (NEM) provides insights into the stock...

Read More >

Buy 1 Month

Get 3 Months!

Special Offer:

Trade Recommendations

Unleash the power of deversified trading with our comprehensive portfolio, covering:

  • Stock Trades
  • Crypto Trades
  • Forex Trades
  • Commodity Trades
Elliott Wave Analysis

Gain a competive edge with expert insights in to:

  • Global Indices
  • US Stocks & ASX Stocks
  • Forex & Crypto
  • Commodities
Top-Notch Trading Tools

Equip yourself with the tools of success:

  • Social Chat
  • Elliott Wave Algorithm
  • Screener
  • TradingLevels
  • Trading Game
7 Elliott Wave Analysts

Stay ahead of the market with daily charts and insightful videos
-Your secret to strategic trading!

JOIN HERE


Welcome to TradingLounge (ASIC A.R.No. 321187), specialists in trades, trading education and technical analysis, covering stocks, indices, commodities, forex and cryptocurrencies.

When you join TradingLounge you have access to everything we offer, including trade tools, educational content and a social platform to chat with like-minded investors.

Read more

@Copyright 2024 by tradinglounge.com

Contact Us

Australian no: 02 4787 6020

International no: +61 (2) 47876020

Pay with:

Find us on