ICICI Bank – ICICIBANK Elliott Wave Analysis (1D Chart)
ICICI Bank Stock Chart Analysis
ICICIBANK Elliott Wave Technical Analysis
Function: Counter Trend (Intermediate degree, orange)
Mode: Corrective
Structure: Impulse
Position: Minute Wave ((ii)) Navy
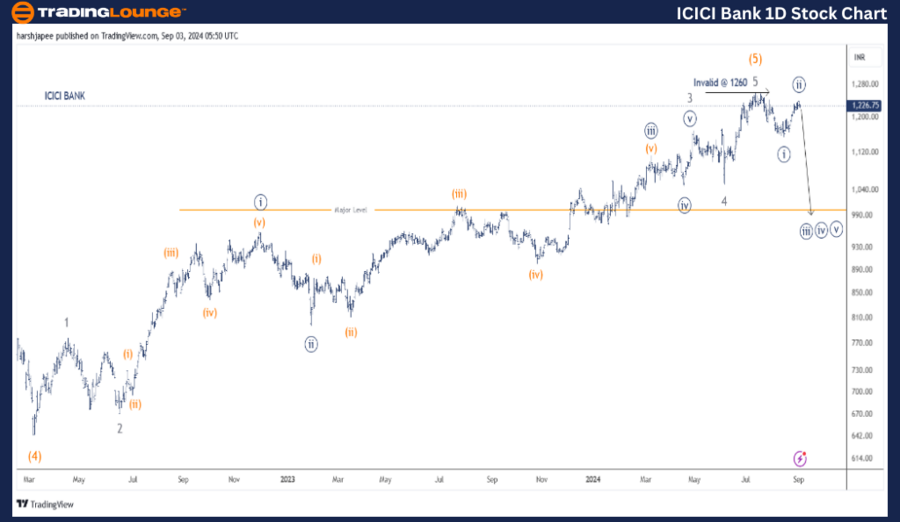
Details: The larger degree Impulse Wave (5) Orange appears complete. Additionally, the stock has formed Minute Wave ((i)) Navy and Wave ((ii)), aligning with previous projections. A downward move is expected from this point as Minute Wave ((iii)) resumes. No change in outlook.
Invalidation Point: 1260-90
ICICI Bank Daily Chart Technical Analysis and Potential Elliott Wave Counts:
The ICICI Bank daily chart signals a potential major top around the 1260 level in July 2024. The stock may have already reversed from this high, with an initial medium-term support target near 1050, corresponding to Minor Wave 4 Grey.
Similar to other major banks, ICICI Bank has experienced a significant rally since March 2022, following the completion of Intermediate Wave (4) near the 640-45 level. The stock has nearly doubled to reach 1260, progressing through five waves and likely concluding Intermediate Wave (5) Orange.
If the proposed wave structure holds, a larger corrective decline could follow against the 1260 high. Alternatively, Minor Wave 3 Grey might have ended at 1260, and Minor Wave 4 could now be unfolding.
ICICI Bank – ICICIBANK Elliott Wave Technical Analysis (4H Chart)
Function: Counter Trend (Intermediate degree, orange)
Mode: Corrective
Structure: Impulse
Position: Minute Wave ((ii)) Navy
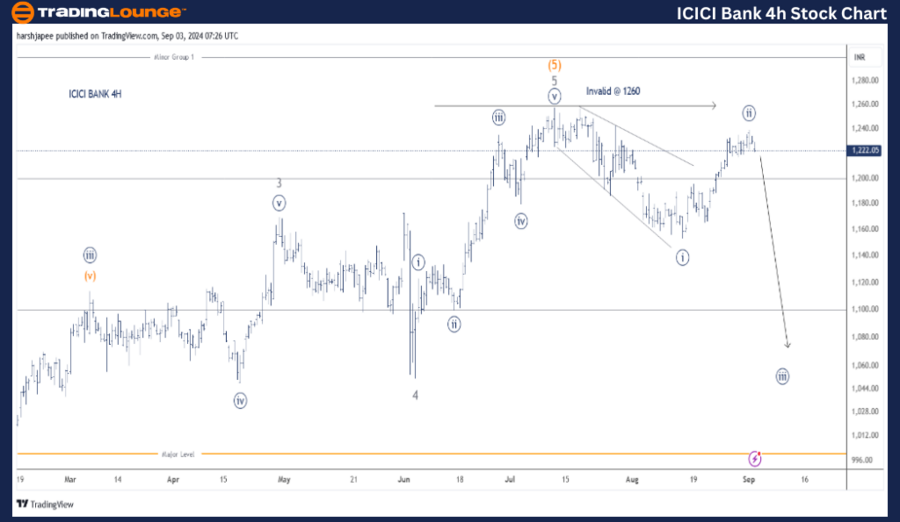
Details: The larger degree Impulse Wave (5) Orange appears complete. Additionally, the stock has formed Minute Wave ((i)) Navy and Wave ((ii)), as previously projected. A downward move is expected from this point as Minute Wave ((iii)) begins to develop.
Invalidation Point: 1260-90
ICICI Bank 4H Chart Technical Analysis and Potential Elliott Wave Counts:
The ICICI Bank 4H chart clearly shows a five-wave rally between 1050 and 1260 levels, indicating the end of Wave 5 Grey. Additionally, lower degree Waves ((i)) and ((ii)) may have formed around the 1155 and 1240 levels, respectively.
If this analysis is correct, Minute Wave ((iii)) Navy should start unfolding lower from the current levels, provided the price remains below 1260. A move above 1260 would invalidate the bearish outlook, suggesting that Wave 5 Grey is extending.
Technical Analyst: Harsh Japee
Source: visit Tradinglounge.com and learn From the Experts Join TradingLounge Here
Previous: AXIS BANK LTD Elliott Wave Technical Analysis
Special Trial Offer - 0.76 Cents a Day for 3 Months! Click here
Access 7 Analysts Over 200 Markets Covered. Chat Room With Support
Conclusion:
ICICI Bank is expected to begin the downward movement of Minor Wave (((iii)) Navy from the current level (1224) against the 1260 high.